Lollipop chart
Nessuno ha ancora preso questa issue.
- Lingua principale
- F#
- Stelle
- 860
- Fork
- 99
- Merge medio
- 22m
- PR unite (30g)
- 1
Descrizione
Description
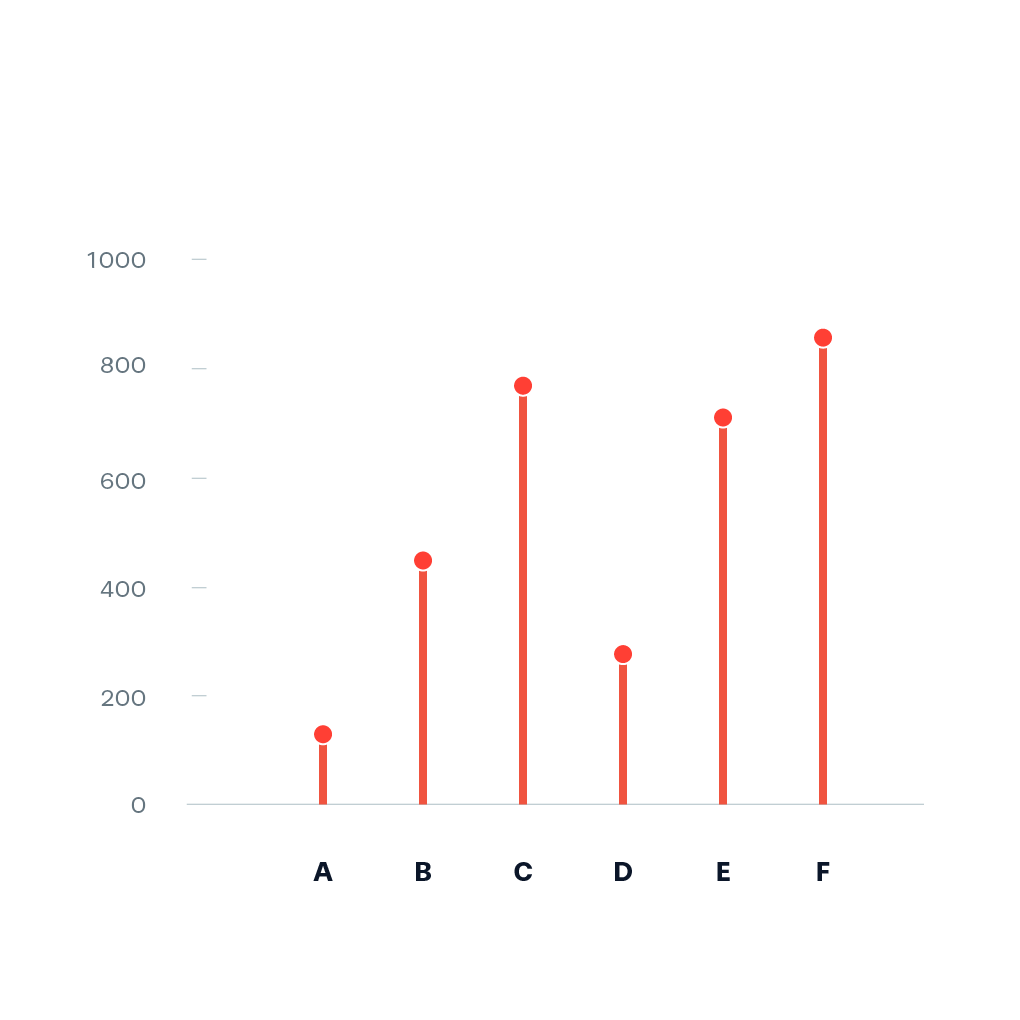
A Lollipop chart is a categorical chart that is basically a bar chart replaced by points being connected by a line to the zero-line of the reference axis representing the data. It can be helpful to reduce visual noise when all values have a similar height [1].
Example:
Pointers
- Ideally, you start prototyping in a scripting or notebook environment where you can iterate fast. installation instructions can be found here: https://plotly.net/#Installation
- Charts like this that are using baseline trace types to create a new chart type should only be implemented in the top-level Chart API. An example where this is already done is the Range chart that combines a set of differently styled line charts.
- When possible, use
#IConvertiblefor data input, as this allows forstrings, number types such asintandfloat, andDateTime.
References
Hints (click to expand if you need additional pointers)
- The most suitable base chart for this is a set of line charts that each connect the zero line to a data point
- The high-level function should look quite similar to the base implementation of
Chart.Bar
Guida per i contributori
Nessuna guida per i contributori indicizzata per questo repository
Come iniziare
- Leggi tutta la issue e poi la guida ai contributi del progetto.
- Commenta sulla issue per dire che te ne occupi tu — evita che due persone facciano lo stesso lavoro.
- Fai un fork del repository e lavora su un branch.
- Apri una pull request che faccia riferimento al numero della issue.
Direzione di ricerca
Inizia in src/Plotly.NET/ChartAPI/Chart2D.fs leggendo le implementazioni esistenti di Range chart e Chart.Bar. Realizza un prototipo in un ambiente di scripting o notebook, utilizzando grafici a linee collegati da zero a ciascun punto dati. Il lavoro è completato quando è disponibile un’API di grafici lollipop di primo livello con un input di dati che supporta #IConvertible e segue i pattern di grafici esistenti della libreria.
Scritto dal modello di indicizzazione a partire dal testo della issue.
Valutazione
- Stack tecnologico
- fsharp
- Ambito
- data-visualization
- Tipo di issue
- Funzionalità
- Difficoltà
- 3/5
- Tempo stimato
- 1-2 giorni
- Stato di attività
- Ferma
- Chiarezza
- Specificata chiaramente
- Idoneità per principianti
- 48/100