matplotlib / matplotlib/ipympl
"Transform()" returns bad coordinates with ipympl
- Dominant language
- Jupyter Notebook
- Stars
- 1.7k
- Forks
- 234
- PR merge metrics
- No merged PRs in 30d
Description
## Describe the issue
I believe the "transform()" functions of Matplotlib do not behave well in ipympl or widget mode.
**Code for reproduction**
I simply use the matplotlib example published here:
https://matplotlib.org/3.1.1/tutorials/advanced/transforms_tutorial.html
I copy/paste the code for basic help :
```python
import numpy as np
import matplotlib.pyplot as plt
import matplotlib.patches as mpatches
x = np.arange(0, 10, 0.005)
y = np.exp(-x/2.) * np.sin(2*np.pi*x)
fig, ax = plt.subplots()
ax.plot(x, y)
ax.set_xlim(0, 10)
ax.set_ylim(-1, 1)
xdata, ydata = 5, 0
xdisplay, ydisplay = ax.transData.transform_point((xdata, ydata))
bbox = dict(boxstyle="round", fc="0.8")
arrowprops = dict(
arrowstyle="->",
connectionstyle="angle,angleA=0,angleB=90,rad=10")
offset = 72
ax.annotate('data = (%.1f, %.1f)' % (xdata, ydata),
(xdata, ydata), xytext=(-2*offset, offset), textcoords='offset points',
bbox=bbox, arrowprops=arrowprops)
disp = ax.annotate('display = (%.1f, %.1f)' % (xdisplay, ydisplay),
(xdisplay, ydisplay), xytext=(0.5*offset, -offset),
xycoords='figure pixels',
textcoords='offset points',
bbox=bbox, arrowprops=arrowprops)
plt.show()
```
**Actual outcome**
I get different results depending on the matplotlib mode :
- on one side, %matplotlib inline gives the result expected and displayed in the example, as below :
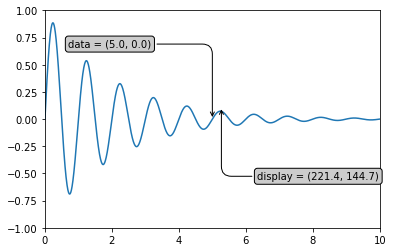
- on the other side, %matplotlib ipympl or %matplotlib widget give erroneous results, as below :

The result is the same if I download with the "floppy-disk" icon of the widget.
**Expected outcome**
The result with widget or ipympl mode should be the one of inline mode.
## Versions
```
3.7.7 (default, Mar 26 2020, 10:32:53)
[Clang 4.0.1 (tags/RELEASE_401/final)]
ipympl version: 0.5.2
jupyter core : 4.6.3
jupyter-notebook : 6.0.3
qtconsole : 4.7.5
ipython : 7.16.1
ipykernel : 5.3.3
jupyter client : 6.1.6
jupyter lab : 1.2.6
nbconvert : 5.6.1
ipywidgets : 7.5.1
nbformat : 5.0.7
traitlets : 4.3.3
Known nbextensions:
config dir: /Users/mmyara/.jupyter/nbconfig
notebook section
jupyter-js-widgets/extension enabled
- Validating: OK
config dir: /opt/miniconda3/etc/jupyter/nbconfig
notebook section
jupyter-matplotlib/extension enabled
- Validating: OK
plotlywidget/extension enabled
- Validating: OK
jupyter-js-widgets/extension enabled
- Validating: OK
tree section
ipyparallel/main enabled
- Validating: OK
JupyterLab v1.2.6
Known labextensions:
app dir: /opt/miniconda3/share/jupyter/lab
@jupyter-widgets/jupyterlab-manager v1.1.0 enabled OK
@jupyterlab/toc v2.0.0 enabled OK
@lckr/jupyterlab_variableinspector v0.4.0 enabled OK
jupyter-matplotlib v0.7.1 enabled OK
jupyterlab-plotly v4.9.0 enabled OK
plotlywidget v4.9.0 enabled OK```
Contributor guide
Research direction
Start by running the provided Matplotlib transform example in inline and ipympl/widget modes, then compare the displayed and saved results. The issue is done when widget mode produces the same coordinates and annotation placement as inline mode.
Written by the indexing model from the issue text.
Assessment
- Tech stack
- jupyter, jupyter-notebook, python
- Domain
- frontend, web-dev
- Issue type
- Bug
- Difficulty
- 4/5
- Estimated time
- 3-5 days
- Activity status
- Stale
- Clarity
- Clearly specified
- Newbie friendliness
- 38/100