plotly / plotly/react-plotly.js
Coordinates of a shape don't work
Nobody has claimed this yet.
- Dominant language
- JavaScript
- Stars
- 1.1k
- Forks
- 138
- Avg merge
- 3d 2h
- Merged PRs (30d)
- 4
Description
Probably it is something very stupid, but it is driving me crazy. I hope someone can help me.
I have been trying using shapes following the instructions... whichever X0, Y0, X1, Y1, I set, the shapes don't change position.
Here following I put a very simple component showing the problem. I would expect an horizontal line at Y = 14, but this is not the case. Whichever are the values in X0, Y0, X1, Y1 and the xref/yref settings the the output is always the same as shown in the attached image
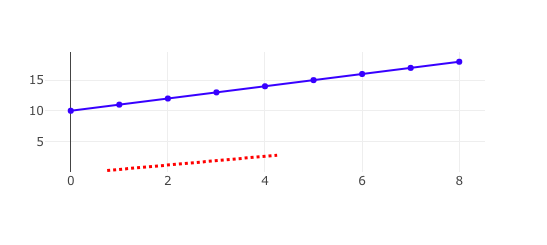
.
import React, { Component } from 'react';
import Plot from 'react-plotly.js';
class App extends Component {
render() {
const data = [{
x: [0,1,2,3,4,5,6,7,8],
y: [10,11,12,13,14,15,16,17,18],
type: 'scatter',
mode: 'lines+points',
marker: { color: 'blue'}
}];
  const layout = {
    width: 600,
    height: 300,
    showlegend: false,
    shapes: [
      {
        type: 'line',
        line: {
          color: 'red',
          width: 3,
          dash: 'dot',
        },
        X0: 0,
        Y0: 14,
        X1: 8,
        Y1: 14
      }
    ]
  };

  return (
    <Plot data={ data } layout={ layout}/>
  )
}
}
export default App;
Contributor guide
No contributing guide indexed for this repository
First steps
- Read the whole issue, then the project's contributing guide.
- Comment on the issue to say you are picking it up — it saves two people doing the same work.
- Fork the repository and make your change on a branch.
- Open a pull request that references the issue number.
Research direction
Start with the supplied App component and inspect the layout.shapes configuration, especially the coordinate property names used for the line. Confirm the example renders a horizontal red line at Y = 14 when the coordinate fields are recognized.
Written by the indexing model from the issue text.
Assessment
- Tech stack
- javascript, react
- Domain
- data-visualization, frontend
- Issue type
- Bug
- Difficulty
- 1/5
- Estimated time
- Under an hour
- Activity status
- Stale
- Clarity
- Clearly specified
- Newbie friendliness
- 50/100