Sunburst figures not aggregating custom_data for parents with >1 leaf
オープン
まだ誰も着手していません。
bug
P3
- 主要言語
- Python
- スター
- 18.8k
- フォーク
- 2.8k
- 平均マージ
- 16時間 26分
- マージ済み PR(30日)
- 21
説明
Consider the following Sunburst figure:
import pandas as pd
import plotly.express as px

data = [
    ["A", "1", 200.0, 20.0],
    ["A", "2", 100.0, 10.0],
    ["A", "3", 350.0, 35.0],
    ["B", "1", 500.0, 50.0],
    ["C", "1", 20.0, 2.0],
    ["C", "2", 50.0, 5.0],
]
columns = ["Category Group", "Category", "Value", "Additional Value"]
df = pd.DataFrame(data, columns=columns)

fig = px.sunburst(df, path=['Category Group', 'Category'], values='Value', custom_data=['Additional Value'])
fig.update_traces(textinfo="label+percent entry")
fig.update_traces(hovertemplate='<b>%{label}</b><br>Value: $%{value}<br>Additional Value: $%{customdata[0]}<br>')
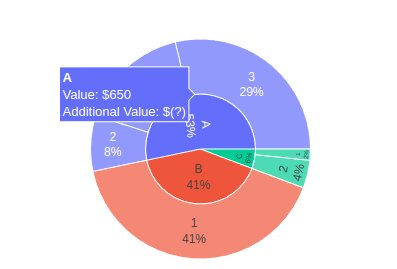
Any parents with >1 leaf do not display the sum of their children for the custom_data field. This behavior is not in line with other fields such as value or color which correctly display the sum of their children
コントリビューションガイド
はじめの一歩
- issue を最後まで読み、次にプロジェクトのコントリビューションガイドを読みます。
- 着手することを issue にコメントします — 二人が同じ作業をするのを防げます。
- リポジトリをフォークし、ブランチを切って変更します。
- issue 番号を参照したプルリクエストを送ります。
調査の方向性
提供された pandas DataFrame と px.sunburst(..., custom_data=...) を使ってケースを再現します。px.sunburst のエントリポイントから結果の figure trace までを追跡し、value と color に対して custom_data の親の値がどのように生成されるかを確認します。parent customdata に、グループ A と C を含め、その葉の値の合計が表示され、既存の動作が維持されれば完了です。
索引モデルが issue の本文から書いたものです。
評価
- 技術スタック
- pandas, plotly, python
- 領域
- data-visualization
- issue の種類
- バグ
- 難易度
- 3/5
- 見積もり時間
- 1〜2日
- 活発さ
- 停滞
- 明瞭さ
- おおむね明確
- 初心者へのやさしさ
- 45/100