Sunburst figures not aggregating custom_data for parents with >1 leaf
未关闭
还没有人认领这个 Issue。
bug
P3
- 主要语言
- Python
- 星标
- 18.8k
- 派生
- 2.8k
- 平均合并
- 16 小时 26 分钟
- 30 天内合并 PR
- 21
描述
Consider the following Sunburst figure:
import pandas as pd
import plotly.express as px

data = [
    ["A", "1", 200.0, 20.0],
    ["A", "2", 100.0, 10.0],
    ["A", "3", 350.0, 35.0],
    ["B", "1", 500.0, 50.0],
    ["C", "1", 20.0, 2.0],
    ["C", "2", 50.0, 5.0],
]
columns = ["Category Group", "Category", "Value", "Additional Value"]
df = pd.DataFrame(data, columns=columns)

fig = px.sunburst(df, path=['Category Group', 'Category'], values='Value', custom_data=['Additional Value'])
fig.update_traces(textinfo="label+percent entry")
fig.update_traces(hovertemplate='<b>%{label}</b><br>Value: $%{value}<br>Additional Value: $%{customdata[0]}<br>')
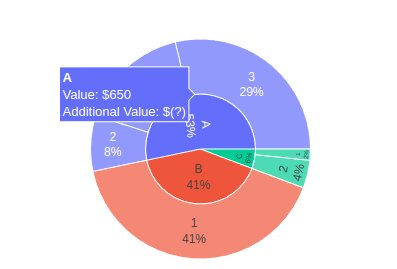
Any parents with >1 leaf do not display the sum of their children for the custom_data field. This behavior is not in line with other fields such as value or color which correctly display the sum of their children
贡献指南
从这里开始
- 先读完整个 Issue,再读项目的贡献指南。
- 在 Issue 下留言说明你要接手 —— 这能避免两个人做同样的事。
- Fork 仓库,在一个分支上完成修改。
- 提交 Pull Request,并在描述里引用这个 Issue 编号。
调研方向
使用提供的 pandas DataFrame 和 px.sunburst(..., custom_data=...) 重现该案例。从 px.sunburst 入口点开始,一直到生成的 figure trace,跟踪 custom_data 相对于 value 和 color 如何生成父级值。完成的标准是:parent customdata 显示其叶节点值的总和,包括组 A 和 C,同时保留现有行为。
由索引模型根据 Issue 内容生成。
评估
- 技术栈
- pandas, plotly, python
- 领域
- data-visualization
- Issue 类型
- 缺陷
- 难度
- 3/5
- 预计耗时
- 1-2 天
- 活跃度
- 停滞
- 描述清晰度
- 基本清楚
- 新手友好度
- 45/100