Surface Plot not potting values properly when there is only one piece of data in a row or column of the data
Nobody has claimed this yet.
- Dominant language
- Python
- Stars
- 18.8k
- Forks
- 2.8k
- Avg merge
- 16h 26m
- Merged PRs (30d)
- 21
Description
Here is the data I wanted to plot:
[[0.45 nan nan nan]
[0.25 0.4 nan nan]
[0.35 0.25 0.4 nan]
[0.4 0.25 0.5 0.25]]
in my code, this is stored in the variable 'result'
my code is the following:
`fig = go.Figure(data=[
go.Surface(z=result)
])
fig.update_layout(scene = dict(
xaxis_title='X axis',
yaxis_title='Y axis',
zaxis_title='Z axis'),
width=700,
margin=dict(r=20, b=10, l=10, t=10))
fig.show()`
the resulting graph is this:
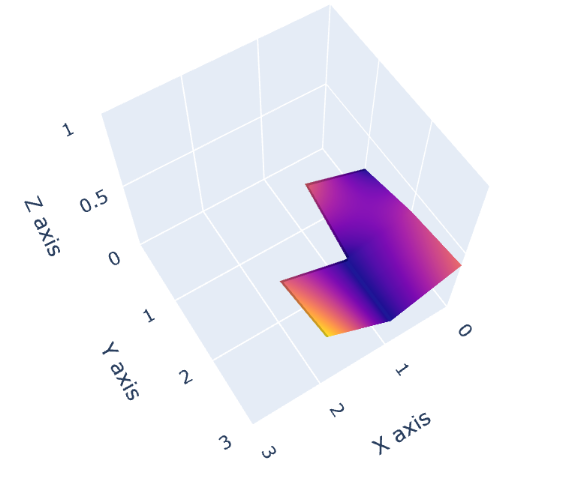
as you can see, 0.45 in the first row of the data is not plotted and 0.25 in the last column of the data is not plotted.
**note: I had to remove a bunch of code in my example for privacy purposes, but this still illustrates the bug.
Contributor guide
First steps
- Read the whole issue, then the project's contributing guide.
- Comment on the issue to say you are picking it up — it saves two people doing the same work.
- Fork the repository and make your change on a branch.
- Open a pull request that references the issue number.
Research direction
Start by running the provided Python example with the shown result matrix and inspect the go.Surface rendering path used by fig.show(). Confirm that the single non-NaN values at the first row and last column are omitted, then verify that both values appear in the rendered surface.
Written by the indexing model from the issue text.
Assessment
- Tech stack
- python
- Domain
- data-visualization
- Issue type
- Bug
- Difficulty
- 3/5
- Estimated time
- 1-2 days
- Activity status
- Stale
- Clarity
- Clearly specified
- Newbie friendliness
- 48/100