enable global consistency of color mapping between animation frames
まだ誰も着手していません。
- 主要言語
- JavaScript
- スター
- 18.3k
- フォーク
- 2k
- 平均マージ
- 2日 12時間
- マージ済み PR(30日)
- 28
説明
Hi, Thanks for this AWESOME project. I really enjoy using it.
The animation function can't keep the global consistency of color mapping between animation frames.
Here is an example in Colab for my use case. In this example, I use Plotly.py with scatter_geo API. My code is as between,
import plotly.express as px
df = px.data.gapminder()
fig = px.scatter_geo(df, locations="iso_alpha",
                     color="lifeExp",
                     hover_name="country",
                     size="pop",
                     animation_frame="year",
                     projection="natural earth")
fig.show()
I expect the color mapping for lifeExp to keep consistent between different frames, which means the same color among frames should represent the same lifeExp value and the color bar should keep the same too. But the result looks like below, in which the frames in 1952 and 1997 can't be comparable.
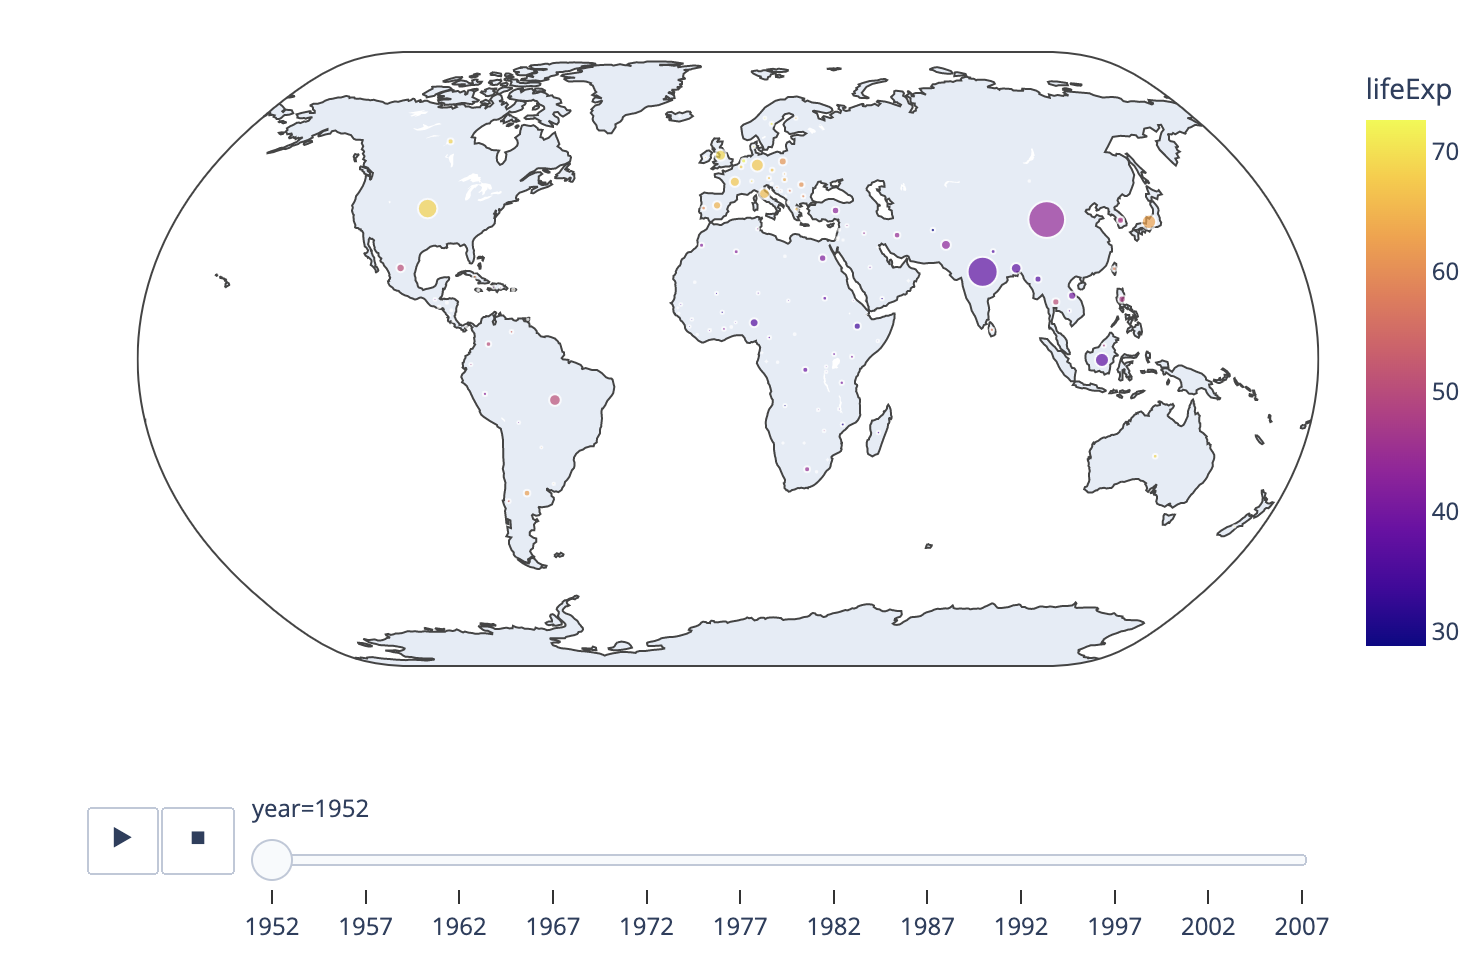

I would expect some API like,
fig = px.scatter_geo(df, locations="iso_alpha",
                     color="lifeExp",
                     keep_color_global_consistency = True,
                     hover_name="country",
                     size="pop",
                     animation_frame="year",
                     projection="natural earth")
eg, it has keep_color_global_consistency option and the default value should be True.
コントリビューションガイド
はじめの一歩
- issue を最後まで読み、次にプロジェクトのコントリビューションガイドを読みます。
- 着手することを issue にコメントします — 二人が同じ作業をするのを防げます。
- リポジトリをフォークし、ブランチを切って変更します。
- issue 番号を参照したプルリクエストを送ります。
調査の方向性
まず、scatter_geo、color、animation_frameを使ったリンク先のColab例を再現します。アニメーションのフレーム間で色のマッピングとカラーバーがどのように扱われるかを確認し、その後、等しい値に比較可能な色が使われ、カラーバーが固定されたままになるようにAPIの動作を定義します。1952年と1997年のフレームを直接比較できれば完了です。
索引モデルが issue の本文から書いたものです。
評価
- 技術スタック
- javascript, python
- 領域
- data-visualization
- issue の種類
- 機能追加
- 難易度
- 5/5
- 見積もり時間
- 1週間以上
- 活発さ
- 停滞
- 明瞭さ
- おおむね明確
- 初心者へのやさしさ
- 25/100