unexpected histogram bin size behavior
Nobody has claimed this yet.
- Dominant language
- JavaScript
- Stars
- 18.3k
- Forks
- 2k
- Avg merge
- 2d 12h
- Merged PRs (30d)
- 28
Description
If the maximum number in the interval is a multiple of the bin size, then this number is lost.
Here is a code example:
var x = [1.0, 9.1, 10.0, 17.8, 18.5, 20.0];

var trace = {
    x: x,
    type: 'histogram',
    autobinx: false,
    xbins: {
      end: 20.0,
      size: 10.0,
      start: 0
    }
};
var data = [trace];
Plotly.newPlot('myDiv', data);
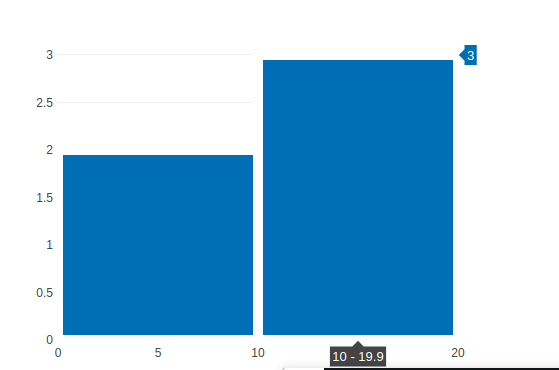
This is the result of using the notation [a; b) when creating groups. This behavior creates a problem, for example, when you want to dynamically adjust the bin size depending on the step. Here is an example:
var data = [1.0, 9.1, 10.0, 17.8, 18.5, 20.0];

step = 1.0; // any value from the interval: [0; 1]

xbins_start = data.reduce((x, y) => Math.min(x, y), 0.0);
xbins_end   = data.reduce((x, y) => Math.max(x, y), 0.0);
xbins_size  = (step * (xbins_end - xbins_start));

var trace = {
    x: data,
    type: 'histogram',
    autobinx: false,
    xbins: {
      start: xbins_start,
      end: xbins_end,
      size: xbins_size
    }
};

Plotly.newPlot('myDiv', [trace]);
By setting the step size to 1, I hope to get the only one group containing all the data values (the height of the bin should be 6), instead I get a height of 5 with the loss of the maximum value.

Contributor guide
First steps
- Read the whole issue, then the project's contributing guide.
- Comment on the issue to say you are picking it up — it saves two people doing the same work.
- Fork the repository and make your change on a branch.
- Open a pull request that references the issue number.
Research direction
Start with the JavaScript reproduction in the issue and trace the histogram binning path for explicit xbins start, end, and size values. Verify the boundary behavior with the provided data and confirm that a value equal to the end is counted in the resulting bin.
Written by the indexing model from the issue text.
Assessment
- Tech stack
- javascript
- Domain
- data-visualization
- Issue type
- Bug
- Difficulty
- 3/5
- Estimated time
- 1-2 days
- Activity status
- Stale
- Clarity
- Mostly clear
- Newbie friendliness
- 35/100