stacked bar chart does not display text when colour is supplied
未关闭
还没有人认领这个 Issue。
- 主要语言
- R
- 星标
- 2.7k
- 派生
- 641
- PR 合并指标
- 30 天内没有已合并 PR
描述
or vice versa - color attribute is ignored
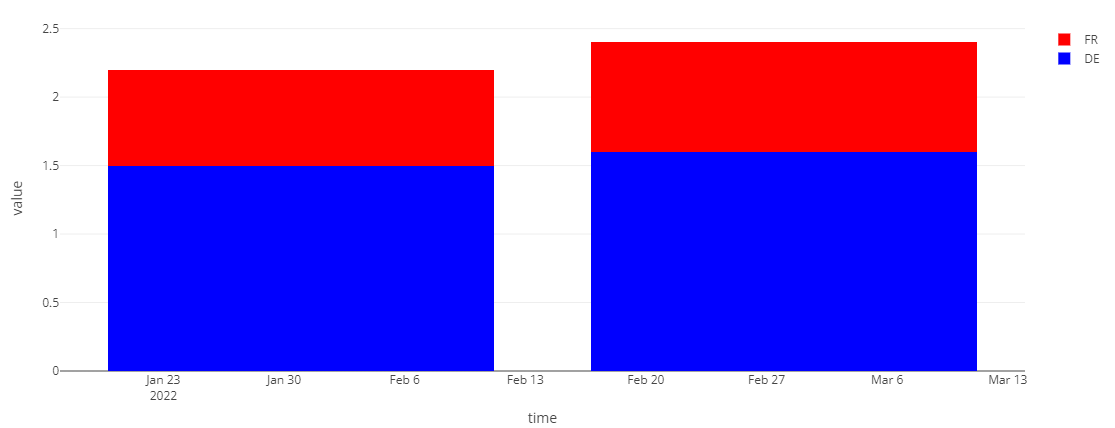
I would like to have stacked bar chart with specific colours & labels for each value, but in current setting color is ignored or the text labels disappear:
library(data.table)
library(plotly)

x <- structure(
  list(time = structure(c(19023, 19023, 19051, 19051), class = "Date"),
       group = structure(c(2L, 1L, 2L, 1L), levels = c("FR", "DE"),
                     class = c("ordered", "factor")),
       value = c(1.5, 0.7, 1.6, 0.8)), row.names = c(NA, -4L),
  class = c("data.table", "data.frame"))
x

my_col <- c('red', 'blue')

plot_ly(x, x = ~time, y = ~value, type = 'bar'
        , name = ~group
        , colors = my_col # ignored
        , text = ~ value, textposition = 'auto'
        ) %>% layout(barmode = 'stack')

# when adding color we lose text:
plot_ly(x, x = ~time, y = ~value, type = 'bar'
        , name = ~group
        , color = ~group
        , colors = my_col
        , text = ~ value, textposition = 'auto'
        ) %>% layout(barmode = 'stack')
# text isnt visiable

plot_ly(x, x = ~time, y = ~value, type = 'bar'
        , color = ~group
        , colors = my_col
        , text = ~ value, textposition = 'auto'
) %>% layout(barmode = 'stack')
# text isnt visiable
贡献指南
从这里开始
- 先读完整个 Issue,再读项目的贡献指南。
- 在 Issue 下留言说明你要接手 —— 这能避免两个人做同样的事。
- Fork 仓库,在一个分支上完成修改。
- 提交 Pull Request,并在描述里引用这个 Issue 编号。
调研方向
在 plotly.R 中重现 issue 中的堆叠条形图示例,将提供的颜色与文本标签进行比较。首先跟踪 R plotly API 如何处理堆叠条形图的颜色和文本;完成的标准是请求的颜色和值标签都能同时保持可见。
由索引模型根据 Issue 内容生成。
评估
- 技术栈
- r
- 领域
- data-visualization
- Issue 类型
- 缺陷
- 难度
- 3/5
- 预计耗时
- 1-2 天
- 活跃度
- 停滞
- 描述清晰度
- 基本清楚
- 新手友好度
- 45/100