stacked bar chart does not display text when colour is supplied
Offen
Dieses Issue hat noch niemand übernommen.
- Vorherrschende Sprache
- R
- Sterne
- 2.7k
- Forks
- 641
- PR-Merge-Kennzahlen
- Keine gemergten PRs in 30 T.
Beschreibung
or vice versa - color attribute is ignored
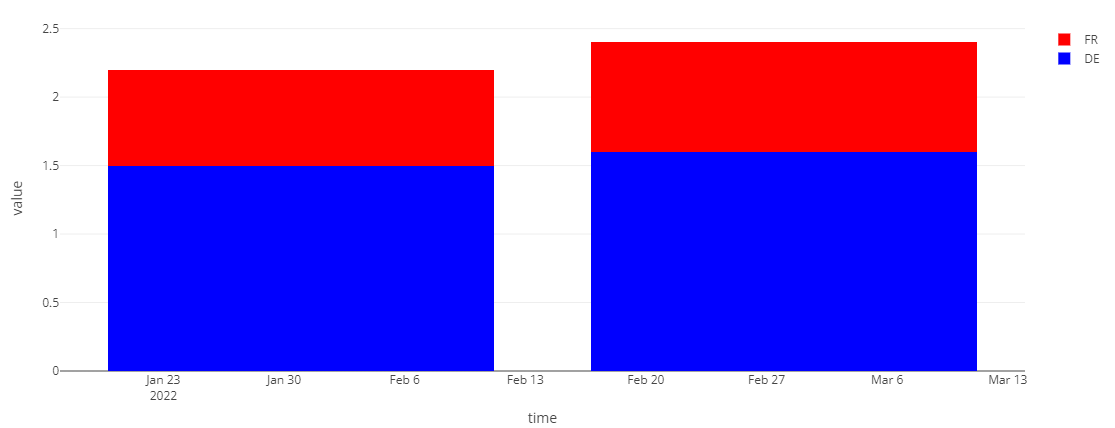
I would like to have stacked bar chart with specific colours & labels for each value, but in current setting color is ignored or the text labels disappear:
library(data.table)
library(plotly)

x <- structure(
  list(time = structure(c(19023, 19023, 19051, 19051), class = "Date"),
       group = structure(c(2L, 1L, 2L, 1L), levels = c("FR", "DE"),
                     class = c("ordered", "factor")),
       value = c(1.5, 0.7, 1.6, 0.8)), row.names = c(NA, -4L),
  class = c("data.table", "data.frame"))
x

my_col <- c('red', 'blue')

plot_ly(x, x = ~time, y = ~value, type = 'bar'
        , name = ~group
        , colors = my_col # ignored
        , text = ~ value, textposition = 'auto'
        ) %>% layout(barmode = 'stack')

# when adding color we lose text:
plot_ly(x, x = ~time, y = ~value, type = 'bar'
        , name = ~group
        , color = ~group
        , colors = my_col
        , text = ~ value, textposition = 'auto'
        ) %>% layout(barmode = 'stack')
# text isnt visiable

plot_ly(x, x = ~time, y = ~value, type = 'bar'
        , color = ~group
        , colors = my_col
        , text = ~ value, textposition = 'auto'
) %>% layout(barmode = 'stack')
# text isnt visiable
Beitragsleitfaden
Erste Schritte
- Lies das ganze Issue und danach den Beitragsleitfaden des Projekts.
- Schreib ins Issue, dass du es übernimmst — das erspart doppelte Arbeit.
- Forke das Repository und arbeite in einem Branch.
- Öffne einen Pull Request, der die Issue-Nummer nennt.
Rechercherichtung
Reproduziere die gestapelten Balkenbeispiele aus dem Issue in plotly.R und vergleiche bereitgestellte Farben mit Textbeschriftungen. Beginne damit nachzuverfolgen, wie die R plotly API Farben und Text für gestapelte Balken verarbeitet; fertig ist es, wenn sowohl die angeforderten Farben als auch die Wertebeschriftungen zusammen sichtbar bleiben.
Vom Indexierungsmodell aus dem Issue-Text verfasst.
Bewertung
- Tech-Stack
- r
- Bereich
- data-visualization
- Issue-Typ
- Bug
- Schwierigkeit
- 3/5
- Geschätzter Aufwand
- 1-2 Tage
- Aktivitätsstatus
- Veraltet
- Klarheit
- Größtenteils klar
- Anfängerfreundlichkeit
- 45/100