Customdata format variations
Open
Nobody has claimed this yet.
- Dominant language
- R
- Stars
- 2.7k
- Forks
- 641
- PR merge metrics
- No merged PRs in 30d
Description
There seems to be a lot of variations regarding the format in which the customdata is structured.
Showcase:
library(plotly)
library(htmlwidgets)

js <- "function(el, x) {
         el.on('plotly_click', function(d) {
           console.log(d);
           console.log(d.points[0].data.customdata[0]);
       });
       }"

X <- data.frame(x = c(1, 2, 1, 2), y = c(1, 1, 2, 2), z = as.character(1:4), mydata = letters[1:4])

gg <- ggplot(X, aes(x = x, y = y, customdata = mydata)) + geom_tile(aes(fill = z))

ggplotly(gg) %>% onRender(js)
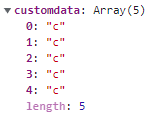
Same as above, except z is now numerical:
X <- data.frame(x = c(1, 2, 1, 2), y = c(1, 1, 2, 2), z = 1:4, mydata = letters[1:4])
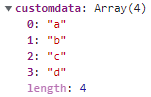
More information in this Stackoverflow post.
Contributor guide
First steps
- Read the whole issue, then the project's contributing guide.
- Comment on the issue to say you are picking it up — it saves two people doing the same work.
- Fork the repository and make your change on a branch.
- Open a pull request that references the issue number.
Research direction
Start by reproducing the two R examples using ggplotly() and htmlwidgets::onRender(), then inspect the customdata received in the plotly_click callback. The issue names no target files or tests and does not define the desired consistent format, so the expected behavior needs to be established before implementation.
Written by the indexing model from the issue text.
Assessment
- Tech stack
- javascript, r
- Domain
- data-visualization
- Issue type
- Bug
- Difficulty
- 4/5
- Estimated time
- 3-5 days
- Activity status
- Stale
- Clarity
- Needs clarification
- Newbie friendliness
- 35/100