2d and 3d plots overlap when using 'subplot' -- previous solution doesn't work for plots with more than one rows
オープン
まだ誰も着手していません。
- 主要言語
- R
- スター
- 2.7k
- フォーク
- 641
- PR マージ指標
- 30日以内にマージされた PR はありません
説明
I met a similar issue to the one posted at 2d and 3d plots overlap when using 'subplot' #579, namely the plots do not align as expected with subplot(). The author of that issue put a solution there, but I found that the solution only works with plots with one row, but doesn't work with plots with several rows. For example:
p1 = plot_ly(x = 1, y = 1)
p2 = plot_ly(x = 1, y = 1, z = 1, type = "scatter3d")
subplot(p1, p2, nrows = 2) %>% layout(scene = list(domain = list(x = c(0, 1), y = c(0.5, 1))))
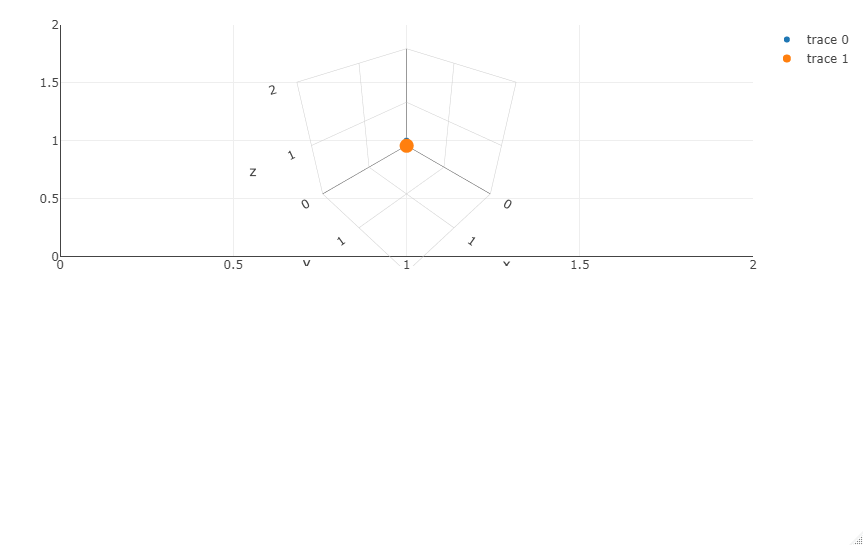
Is that a bug in the package? And are there possible workarounds? Thanks in advance for following this issue.
コントリビューションガイド
はじめの一歩
- issue を最後まで読み、次にプロジェクトのコントリビューションガイドを読みます。
- 着手することを issue にコメントします — 二人が同じ作業をするのを防げます。
- リポジトリをフォークし、ブランチを切って変更します。
- issue 番号を参照したプルリクエストを送ります。
調査の方向性
まず、plot_ly()、subplot()、nrows = 2、layout(scene = ...) を使用して、提供された R の再現コードを実行します。複数行にまたがる 2D と 3D の混在プロットに対する subplot() の処理を読み、リンクされた issue の 1 行の場合の解決策と比較します。報告された複数行のケースでプロットが重ならなくなるか、サポートされている回避策が文書化されれば完了です。
索引モデルが issue の本文から書いたものです。
評価
- 技術スタック
- r
- 領域
- data-visualization
- issue の種類
- バグ
- 難易度
- 4/5
- 見積もり時間
- 3〜5日
- 活発さ
- 停滞
- 明瞭さ
- おおむね明確
- 初心者へのやさしさ
- 35/100