2d and 3d plots overlap when using 'subplot' -- previous solution doesn't work for plots with more than one rows
Dieses Issue hat noch niemand übernommen.
- Vorherrschende Sprache
- R
- Sterne
- 2.7k
- Forks
- 641
- PR-Merge-Kennzahlen
- Keine gemergten PRs in 30 T.
Beschreibung
I met a similar issue to the one posted at 2d and 3d plots overlap when using 'subplot' #579, namely the plots do not align as expected with subplot(). The author of that issue put a solution there, but I found that the solution only works with plots with one row, but doesn't work with plots with several rows. For example:
p1 = plot_ly(x = 1, y = 1)
p2 = plot_ly(x = 1, y = 1, z = 1, type = "scatter3d")
subplot(p1, p2, nrows = 2) %>% layout(scene = list(domain = list(x = c(0, 1), y = c(0.5, 1))))
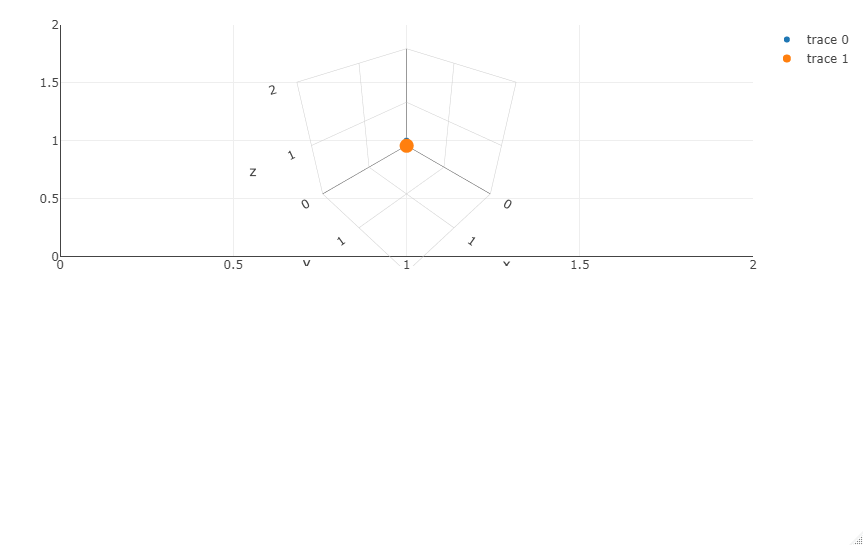
Is that a bug in the package? And are there possible workarounds? Thanks in advance for following this issue.
Beitragsleitfaden
Erste Schritte
- Lies das ganze Issue und danach den Beitragsleitfaden des Projekts.
- Schreib ins Issue, dass du es übernimmst — das erspart doppelte Arbeit.
- Forke das Repository und arbeite in einem Branch.
- Öffne einen Pull Request, der die Issue-Nummer nennt.
Rechercherichtung
Beginne damit, den bereitgestellten R-Reproduzierer mit plot_ly(), subplot(), nrows = 2 und layout(scene = ...) auszuführen. Lies die Behandlung von subplot() für gemischte 2D- und 3D-Diagramme über mehrere Zeilen hinweg und vergleiche sie mit der Einzeilenlösung im verlinkten Issue. Erledigt ist die Aufgabe, wenn sich die Diagramme im gemeldeten Fall mit mehreren Zeilen nicht mehr überlappen oder der unterstützte Workaround dokumentiert ist.
Vom Indexierungsmodell aus dem Issue-Text verfasst.
Bewertung
- Tech-Stack
- r
- Bereich
- data-visualization
- Issue-Typ
- Bug
- Schwierigkeit
- 4/5
- Geschätzter Aufwand
- 3-5 Tage
- Aktivitätsstatus
- Veraltet
- Klarheit
- Größtenteils klar
- Anfängerfreundlichkeit
- 35/100