`add_annotations` incompatible with multicategory axis
未关闭
还没有人认领这个 Issue。
- 主要语言
- R
- 星标
- 2.7k
- 派生
- 641
- PR 合并指标
- 30 天内没有已合并 PR
描述
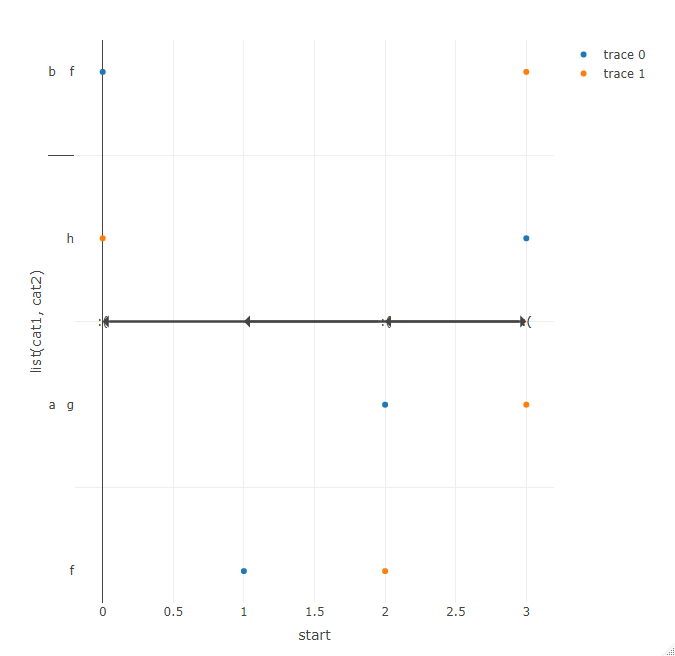
I've been attempting to plot horizontal arrows using add_annotations in a plotly object with a multicategory y-axis. Instead of positioning annotations along the y-axis, they are all positioned at the origin.
(Because the same behavior occurs with other types of annotation, I have included some text in the reprex as well.)
library(tibble)
library(plotly)
#> Loading required package: ggplot2
#>
#> Attaching package: 'plotly'
#> The following object is masked from 'package:ggplot2':
#>
#>     last_plot
#> The following object is masked from 'package:stats':
#>
#>     filter
#> The following object is masked from 'package:graphics':
#>
#>     layout

tribble(
  ~cat1, ~cat2, ~start, ~end,
  "a", "f", 1, 2,
  "a", "g", 2, 3,
  "a", "h", 3, 0,
  "b", "f", 0, 3
  ) %>%
  plot_ly(y = ~list(cat1, cat2)) %>%
  add_markers(x = ~start) %>%
  add_markers(x = ~end) %>%
  add_annotations(text = ":(",
                  showarrow = TRUE,
                  xref = "x", axref = "x",
                  yref = "y", ayref = "y",
                  x = ~start,
                  ax = ~end,
                  y = ~list(cat1, cat2),
                  ay = ~list(cat1, cat2))
贡献指南
从这里开始
- 先读完整个 Issue,再读项目的贡献指南。
- 在 Issue 下留言说明你要接手 —— 这能避免两个人做同样的事。
- Fork 仓库,在一个分支上完成修改。
- 提交 Pull Request,并在描述里引用这个 Issue 编号。
调研方向
从提供的 R reprex 和 add_annotations 入口点开始,然后跟踪 multicategory y-axis 值在 annotations 和 markers 中的处理方式。使用该示例重现 origin 定位,并验证使用 list(cat1, cat2) 的 annotations 是否沿 multicategory axis 定位,且不会导致其他 annotation types 出现回归。
由索引模型根据 Issue 内容生成。
评估
- 技术栈
- r
- 领域
- data-visualization
- Issue 类型
- 缺陷
- 难度
- 4/5
- 预计耗时
- 3-5 天
- 活跃度
- 停滞
- 描述清晰度
- 基本清楚
- 新手友好度
- 35/100