`add_annotations` incompatible with multicategory axis
Nessuno ha ancora preso questa issue.
- Lingua principale
- R
- Stelle
- 2.7k
- Fork
- 641
- Metriche di merge delle PR
- Nessuna PR unita negli ultimi 30g
Descrizione
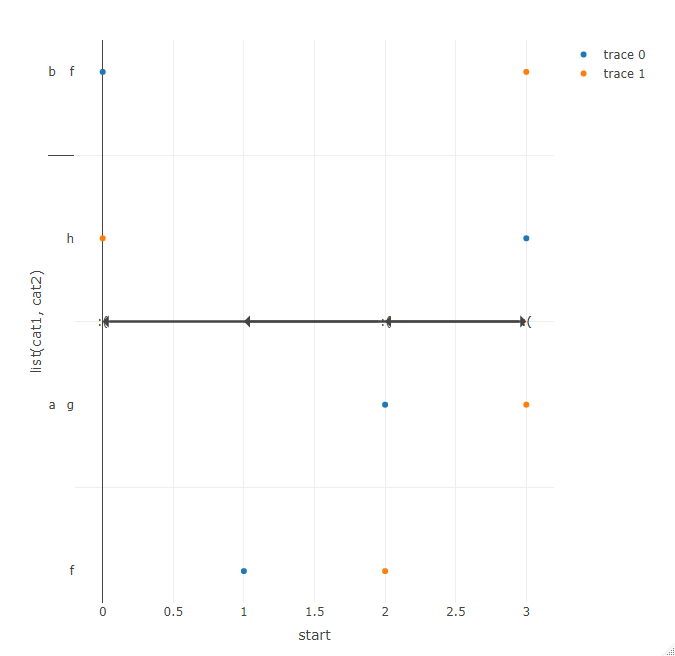
I've been attempting to plot horizontal arrows using add_annotations in a plotly object with a multicategory y-axis. Instead of positioning annotations along the y-axis, they are all positioned at the origin.
(Because the same behavior occurs with other types of annotation, I have included some text in the reprex as well.)
library(tibble)
library(plotly)
#> Loading required package: ggplot2
#>
#> Attaching package: 'plotly'
#> The following object is masked from 'package:ggplot2':
#>
#>     last_plot
#> The following object is masked from 'package:stats':
#>
#>     filter
#> The following object is masked from 'package:graphics':
#>
#>     layout

tribble(
  ~cat1, ~cat2, ~start, ~end,
  "a", "f", 1, 2,
  "a", "g", 2, 3,
  "a", "h", 3, 0,
  "b", "f", 0, 3
  ) %>%
  plot_ly(y = ~list(cat1, cat2)) %>%
  add_markers(x = ~start) %>%
  add_markers(x = ~end) %>%
  add_annotations(text = ":(",
                  showarrow = TRUE,
                  xref = "x", axref = "x",
                  yref = "y", ayref = "y",
                  x = ~start,
                  ax = ~end,
                  y = ~list(cat1, cat2),
                  ay = ~list(cat1, cat2))
Guida per i contributori
Apri la guida per i contributori
Come iniziare
- Leggi tutta la issue e poi la guida ai contributi del progetto.
- Commenta sulla issue per dire che te ne occupi tu — evita che due persone facciano lo stesso lavoro.
- Fai un fork del repository e lavora su un branch.
- Apri una pull request che faccia riferimento al numero della issue.
Direzione di ricerca
Inizia con il R reprex fornito e l’entry point add_annotations, quindi traccia come vengono gestiti i valori della multicategory y-axis per annotations rispetto a markers. Riproduci il posizionamento dell’origine con l’esempio e verifica che le annotations che usano list(cat1, cat2) siano posizionate lungo la multicategory axis senza introdurre regressioni negli altri annotation types.
Scritto dal modello di indicizzazione a partire dal testo della issue.
Valutazione
- Stack tecnologico
- r
- Ambito
- data-visualization
- Tipo di issue
- Bug
- Difficoltà
- 4/5
- Tempo stimato
- 3-5 giorni
- Stato di attività
- Ferma
- Chiarezza
- Abbastanza chiara
- Idoneità per principianti
- 35/100