`add_annotations` incompatible with multicategory axis
Dieses Issue hat noch niemand übernommen.
- Vorherrschende Sprache
- R
- Sterne
- 2.7k
- Forks
- 641
- PR-Merge-Kennzahlen
- Keine gemergten PRs in 30 T.
Beschreibung
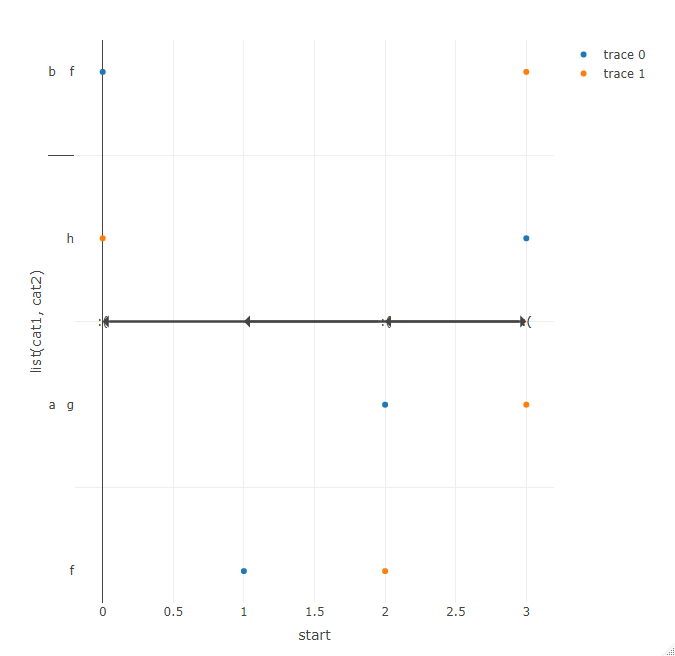
I've been attempting to plot horizontal arrows using add_annotations in a plotly object with a multicategory y-axis. Instead of positioning annotations along the y-axis, they are all positioned at the origin.
(Because the same behavior occurs with other types of annotation, I have included some text in the reprex as well.)
library(tibble)
library(plotly)
#> Loading required package: ggplot2
#>
#> Attaching package: 'plotly'
#> The following object is masked from 'package:ggplot2':
#>
#>     last_plot
#> The following object is masked from 'package:stats':
#>
#>     filter
#> The following object is masked from 'package:graphics':
#>
#>     layout

tribble(
  ~cat1, ~cat2, ~start, ~end,
  "a", "f", 1, 2,
  "a", "g", 2, 3,
  "a", "h", 3, 0,
  "b", "f", 0, 3
  ) %>%
  plot_ly(y = ~list(cat1, cat2)) %>%
  add_markers(x = ~start) %>%
  add_markers(x = ~end) %>%
  add_annotations(text = ":(",
                  showarrow = TRUE,
                  xref = "x", axref = "x",
                  yref = "y", ayref = "y",
                  x = ~start,
                  ax = ~end,
                  y = ~list(cat1, cat2),
                  ay = ~list(cat1, cat2))
Beitragsleitfaden
Erste Schritte
- Lies das ganze Issue und danach den Beitragsleitfaden des Projekts.
- Schreib ins Issue, dass du es übernimmst — das erspart doppelte Arbeit.
- Forke das Repository und arbeite in einem Branch.
- Öffne einen Pull Request, der die Issue-Nummer nennt.
Rechercherichtung
Beginnen Sie mit dem bereitgestellten R reprex und dem Einstiegspunkt add_annotations und verfolgen Sie anschließend, wie Werte der multicategory y-axis für annotations im Vergleich zu markers verarbeitet werden. Reproduzieren Sie die Positionierung des Ursprungs mit dem Beispiel und überprüfen Sie, dass annotations mit list(cat1, cat2) entlang der multicategory axis positioniert werden, ohne andere annotation types zu beeinträchtigen.
Vom Indexierungsmodell aus dem Issue-Text verfasst.
Bewertung
- Tech-Stack
- r
- Bereich
- data-visualization
- Issue-Typ
- Bug
- Schwierigkeit
- 4/5
- Geschätzter Aufwand
- 3-5 Tage
- Aktivitätsstatus
- Veraltet
- Klarheit
- Größtenteils klar
- Anfängerfreundlichkeit
- 35/100