geom_line becomes invisible when color aesthetic applied
Nobody has claimed this yet.
- Dominant language
- R
- Stars
- 2.7k
- Forks
- 641
- PR merge metrics
- No merged PRs in 30d
Description
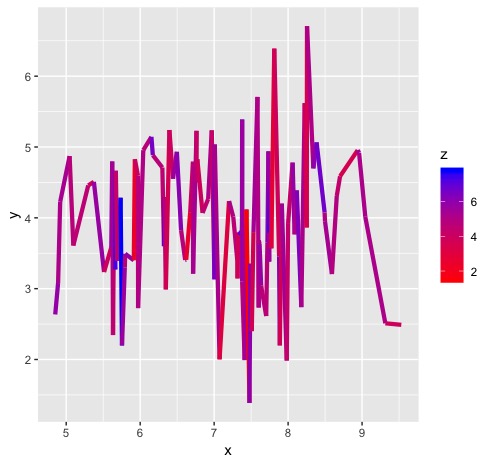
I am attempting to apply a gradient color scale to a line in a ggplot object. When I create the plotly chart, the plotted line is not visible. Hovering over the plot area shows the values of the variables if the cursor is where the line is located, even though the line is not visible.
If I do not apply a color aesthetic, the line is visible.
I have download the most recent plotly package from Github.
Here is some example code of the issue:
library(tidyverse)

df <- tibble(
x = rnorm(100, 7, 1),
y = rnorm(100, 4, 1),
z = rnorm(100, 5, 1))

plot <- ggplot(df) +
geom_line(aes(x, y, color = z),
lwd = 1.5) +
scale_color_gradient(low = "red",
high = "blue")

plot

plotly::plotly_build(plot)
ggplot:

Contributor guide
First steps
- Read the whole issue, then the project's contributing guide.
- Comment on the issue to say you are picking it up — it saves two people doing the same work.
- Fork the repository and make your change on a branch.
- Open a pull request that references the issue number.
Research direction
Start by running the issue's R example with ggplot2, geom_line(), scale_color_gradient(), and plotly::plotly_build(plot), comparing it with the version without a color aesthetic. Trace the conversion from the colored ggplot line to the Plotly chart; done means the line is visible while retaining its gradient colors and hover values.
Written by the indexing model from the issue text.
Assessment
- Tech stack
- r
- Domain
- data-visualization
- Issue type
- Bug
- Difficulty
- 3/5
- Estimated time
- 1-2 days
- Activity status
- Stale
- Clarity
- Mostly clear
- Newbie friendliness
- 38/100