microsoft / microsoft/vscode-cpptools
Gives confusing hints when different defining spellings.
Nessuno ha ancora preso questa issue.
- Lingua principale
- TypeScript
- Stelle
- 6.2k
- Fork
- 1.7k
- Merge medio
- 14h 46m
- PR unite (30g)
- 61
Descrizione
Environment
- OS and version: Windows 7 x64 SP1 and Neon Linux 5.24
- VS Code: 1.67.2
- C/C++ extension: 1.10.4 and 1.9.8
- OS and version of remote machine (if applicable):
- GDB / LLDB version: gdb 9.2 on Neon Linux and gdb 11.2 on Windows 7
Bug Summary and Steps to Reproduce
Bug Summary:
variable value hint bug when debug
code like this
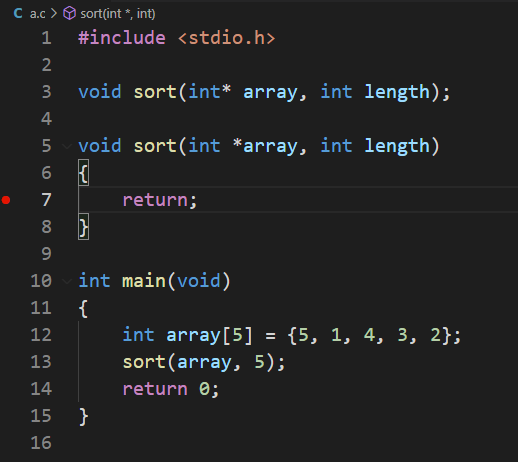
Steps to reproduce:
- start debug
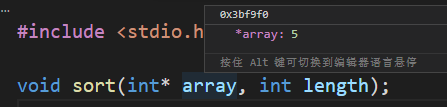
int* array show array's addreess.
int *array show array's element (first element of array).
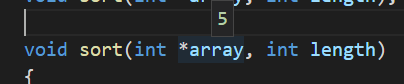
I got confused a bit when I saw this, when I was debugging.
I think this behavior is weird, and it should be displaying the array address, not an indirect operation on the array address. These two ways of writing should have the same display content, right?
Should a judgment be added to distinguish whether the identifier is in the definition or the value?
Debugger Configurations
# tasks.json

// tasks.json

{
    "tasks": [
        {
            "type": "cppbuild",
            "label": "C/C++: gcc.exe 生成活动文件",
            // "command": "D:\\SoftwareInstallation\\Windows7\\ProgramFiles\\MinGW-w64\\win32\\bin\\gcc.exe",
            "command": "D:\\SoftwareInstallation\\Windows7\\ProgramFiles\\MinGW-w64\\posix-new\\winlibs-x86_64-posix-seh-gcc-11.3.0-mingw-w64msvcrt-10.0.0-r2\\mingw64\\bin\\gcc.exe",
            "args": [
                "-fdiagnostics-color=always",
                "-g",
                "${file}",
                "-o",
                "${workspaceFolder}\\bin\\${fileBasenameNoExtension}.exe",
                "-fexec-charset=GBK"
            ],
            "options": {
                "cwd": "${workspaceFolder}"
            },
            "problemMatcher": [
                "$gcc"
            ],
            "group": {
                "kind": "build",
                "isDefault": true
            },
            "detail": "调试器生成的任务。",
            "presentation": {
                "echo": true,
                "reveal": "silent",
                "focus": false,
                "panel": "shared",
                "showReuseMessage": false,
                "clear": false
            }
        }
    ],
    "version": "2.0.0"
}


# launch.json
```json
{
	// 使用 IntelliSense 了解相关属性。
	// 悬停以查看现有属性的描述。
	// 欲了解更多信息,请访问: https://go.microsoft.com/fwlink/?linkid=830387
	"version": "0.2.0",
	"configurations": [
		{
			"name": "gcc.exe - 生成和调试活动文件",
			"type": "cppdbg",
			"request": "launch",
			"program": "${workspaceFolder}\\bin\\${fileBasenameNoExtension}.exe",
			"args": [],
			"stopAtEntry": false,
			"cwd": "${workspaceFolder}",
			"environment": [],
			"externalConsole": false,
			"MIMode": "gdb",
			// "miDebuggerPath": "D:\\SoftwareInstallation\\Windows7\\ProgramFiles\\MinGW-w64\\win32\\bin\\gdb.exe",
			"miDebuggerPath": "D:\\SoftwareInstallation\\Windows7\\ProgramFiles\\MinGW-w64\\posix-new\\winlibs-x86_64-posix-seh-gcc-11.3.0-mingw-w64msvcrt-10.0.0-r2\\mingw64\\bin\\gdb.exe",
			"setupCommands": [
				{
					"description": "为 gdb 启用整齐打印",
					"text": "-enable-pretty-printing",
					"ignoreFailures": true
				}
			],
			"preLaunchTask": "C/C++: gcc.exe 生成活动文件"
		}
	]
}
### Debugger Logs

```shell
none
Other Extensions
No response
Additional Information
No response
Guida per i contributori
Apri la guida per i contributori
Come iniziare
- Leggi tutta la issue e poi la guida ai contributi del progetto.
- Commenta sulla issue per dire che te ne occupi tu — evita che due persone facciano lo stesso lavoro.
- Fai un fork del repository e lavora su un branch.
- Apri una pull request che faccia riferimento al numero della issue.
Direzione di ricerca
Inizia riproducendo il comportamento con le configurazioni tasks.json e launch.json fornite, usando le versioni di GDB indicate e le due forme di dichiarazione dei puntatori. Confronta il valore visualizzato dal debugger per ogni caso e analizza il punto di ingresso dell'estensione C/C++ per l'hint delle variabili o la valutazione delle espressioni; il lavoro è concluso quando il comportamento di visualizzazione è chiaramente definito e coperto da un test di regressione.
Scritto dal modello di indicizzazione a partire dal testo della issue.
Valutazione
- Stack tecnologico
- cpp, typescript
- Ambito
- devtools
- Tipo di issue
- Bug
- Difficoltà
- 4/5
- Tempo stimato
- 3-5 giorni
- Stato di attività
- Ferma
- Chiarezza
- Da chiarire
- Idoneità per principianti
- 32/100