microsoft / microsoft/vscode-cpptools
Gives confusing hints when different defining spellings.
Nobody has claimed this yet.
- Dominant language
- TypeScript
- Stars
- 6.2k
- Forks
- 1.7k
- Avg merge
- 14h 46m
- Merged PRs (30d)
- 61
Description
Environment
- OS and version: Windows 7 x64 SP1 and Neon Linux 5.24
- VS Code: 1.67.2
- C/C++ extension: 1.10.4 and 1.9.8
- OS and version of remote machine (if applicable):
- GDB / LLDB version: gdb 9.2 on Neon Linux and gdb 11.2 on Windows 7
Bug Summary and Steps to Reproduce
Bug Summary:
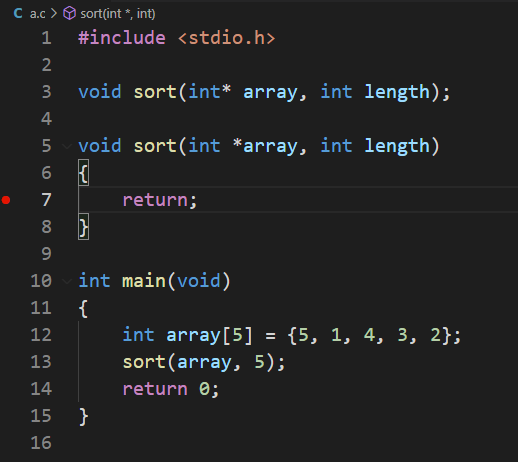
variable value hint bug when debug
code like this
Steps to reproduce:
- start debug
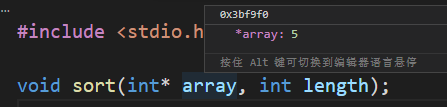
int* array show array's addreess.
int *array show array's element (first element of array).
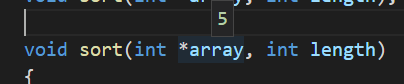
I got confused a bit when I saw this, when I was debugging.
I think this behavior is weird, and it should be displaying the array address, not an indirect operation on the array address. These two ways of writing should have the same display content, right?
Should a judgment be added to distinguish whether the identifier is in the definition or the value?
Debugger Configurations
# tasks.json

// tasks.json

{
    "tasks": [
        {
            "type": "cppbuild",
            "label": "C/C++: gcc.exe 生成活动文件",
            // "command": "D:\\SoftwareInstallation\\Windows7\\ProgramFiles\\MinGW-w64\\win32\\bin\\gcc.exe",
            "command": "D:\\SoftwareInstallation\\Windows7\\ProgramFiles\\MinGW-w64\\posix-new\\winlibs-x86_64-posix-seh-gcc-11.3.0-mingw-w64msvcrt-10.0.0-r2\\mingw64\\bin\\gcc.exe",
            "args": [
                "-fdiagnostics-color=always",
                "-g",
                "${file}",
                "-o",
                "${workspaceFolder}\\bin\\${fileBasenameNoExtension}.exe",
                "-fexec-charset=GBK"
            ],
            "options": {
                "cwd": "${workspaceFolder}"
            },
            "problemMatcher": [
                "$gcc"
            ],
            "group": {
                "kind": "build",
                "isDefault": true
            },
            "detail": "调试器生成的任务。",
            "presentation": {
                "echo": true,
                "reveal": "silent",
                "focus": false,
                "panel": "shared",
                "showReuseMessage": false,
                "clear": false
            }
        }
    ],
    "version": "2.0.0"
}


# launch.json
```json
{
	// 使用 IntelliSense 了解相关属性。
	// 悬停以查看现有属性的描述。
	// 欲了解更多信息,请访问: https://go.microsoft.com/fwlink/?linkid=830387
	"version": "0.2.0",
	"configurations": [
		{
			"name": "gcc.exe - 生成和调试活动文件",
			"type": "cppdbg",
			"request": "launch",
			"program": "${workspaceFolder}\\bin\\${fileBasenameNoExtension}.exe",
			"args": [],
			"stopAtEntry": false,
			"cwd": "${workspaceFolder}",
			"environment": [],
			"externalConsole": false,
			"MIMode": "gdb",
			// "miDebuggerPath": "D:\\SoftwareInstallation\\Windows7\\ProgramFiles\\MinGW-w64\\win32\\bin\\gdb.exe",
			"miDebuggerPath": "D:\\SoftwareInstallation\\Windows7\\ProgramFiles\\MinGW-w64\\posix-new\\winlibs-x86_64-posix-seh-gcc-11.3.0-mingw-w64msvcrt-10.0.0-r2\\mingw64\\bin\\gdb.exe",
			"setupCommands": [
				{
					"description": "为 gdb 启用整齐打印",
					"text": "-enable-pretty-printing",
					"ignoreFailures": true
				}
			],
			"preLaunchTask": "C/C++: gcc.exe 生成活动文件"
		}
	]
}
### Debugger Logs

```shell
none
Other Extensions
No response
Additional Information
No response
Contributor guide
First steps
- Read the whole issue, then the project's contributing guide.
- Comment on the issue to say you are picking it up — it saves two people doing the same work.
- Fork the repository and make your change on a branch.
- Open a pull request that references the issue number.
Research direction
Start by reproducing the behavior with the supplied tasks.json and launch.json configurations, using the reported GDB versions and the two pointer declaration spellings. Compare the debugger's displayed value for each case and inspect the C/C++ extension's variable-hint or expression-evaluation entry point; done means the display behavior is clearly defined and covered by a regression test.
Written by the indexing model from the issue text.
Assessment
- Tech stack
- cpp, typescript
- Domain
- devtools
- Issue type
- Bug
- Difficulty
- 4/5
- Estimated time
- 3-5 days
- Activity status
- Stale
- Clarity
- Needs clarification
- Newbie friendliness
- 32/100