ISISComputingGroup / ISISComputingGroup/IBEX
Log Plotter: Plot whether you were running
- 主要言語
- 言語のデータがありません
- スター
- 6
- フォーク
- 2
- 平均マージ
- 16時間 40分
- マージ済み PR(30日)
- 2
説明
As a muon instrument scientist I would like to easily see the periods where I was running alongside the values of blocks in a plot. Currently the best we can do is plot the runstate but this is quite a manual process as documented at (https://github.com/ISISComputingGroup/ibex_user_manual/wiki/Plot-a-Block-Graph#plot-a-graph-of-the-runstate) and gives something that isn't very user friendly:
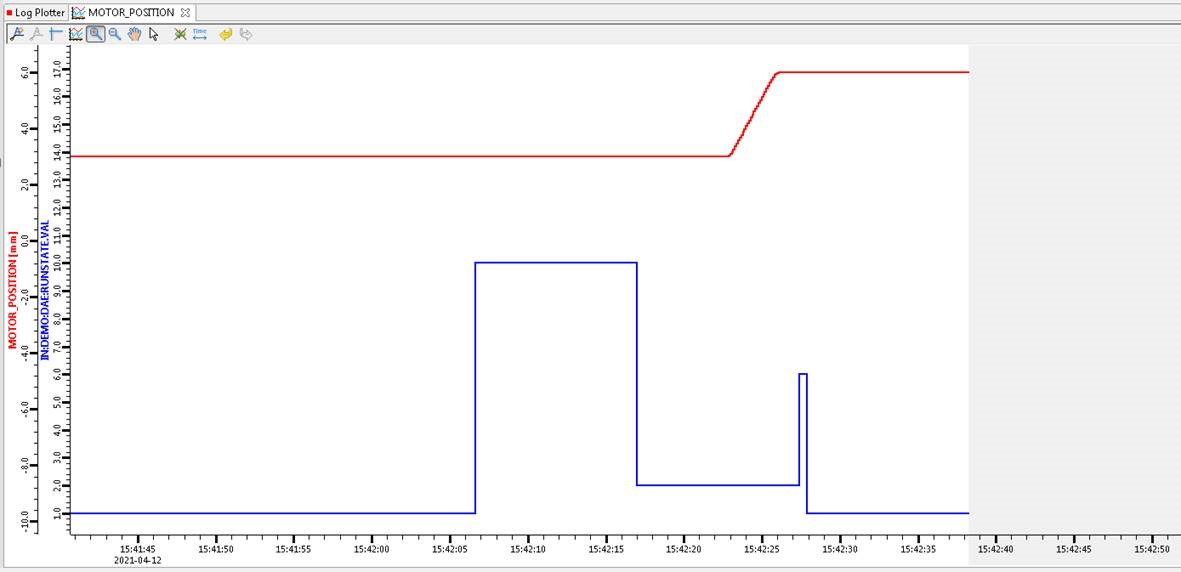
## Acceptance Criteria
* It is easier to plot this information (maybe a checkbox on the log plotter itself or by right clicking on the dashboard)
* The information is easier to interpret, at a minimum we should reduce the states down to just running/not running but ideally scientists would like a shaded area for the running parts (like requested in https://github.com/ISISComputingGroup/IBEX/issues/4738)
* If the shaded area is too hard spin into a new ticket
コントリビューションガイド
このリポジトリのコントリビューションガイドは索引されていません
調査の方向性
既存の Log Plotter と、リンクされている「Plot a Block Graph」runstate workflow から始めてください。現在、実行状態がどのように公開されているか、また plotter がブロック値をどのように受け取っているかを確認してください。完了条件は、ユーザーが実行中/非実行中の期間を簡単に plot に含め、明確に解釈できることです。必要であれば、網掛け領域は別のフォローアップとして扱ってください。
索引モデルが issue の本文から書いたものです。
評価
- 領域
- data-visualization
- issue の種類
- 機能追加
- 難易度
- 4/5
- 見積もり時間
- 3〜5日
- 活発さ
- 停滞
- 明瞭さ
- おおむね明確
- 初心者へのやさしさ
- 38/100