ISISComputingGroup / ISISComputingGroup/IBEX
Log Plotter: Plot whether you were running
- Lenguaje dominante
- Sin datos de lenguaje
- Estrellas
- 6
- Forks
- 2
- Merge medio
- 16 h 40 min
- PR fusionados (30 d)
- 2
Descripción
As a muon instrument scientist I would like to easily see the periods where I was running alongside the values of blocks in a plot. Currently the best we can do is plot the runstate but this is quite a manual process as documented at (https://github.com/ISISComputingGroup/ibex_user_manual/wiki/Plot-a-Block-Graph#plot-a-graph-of-the-runstate) and gives something that isn't very user friendly:
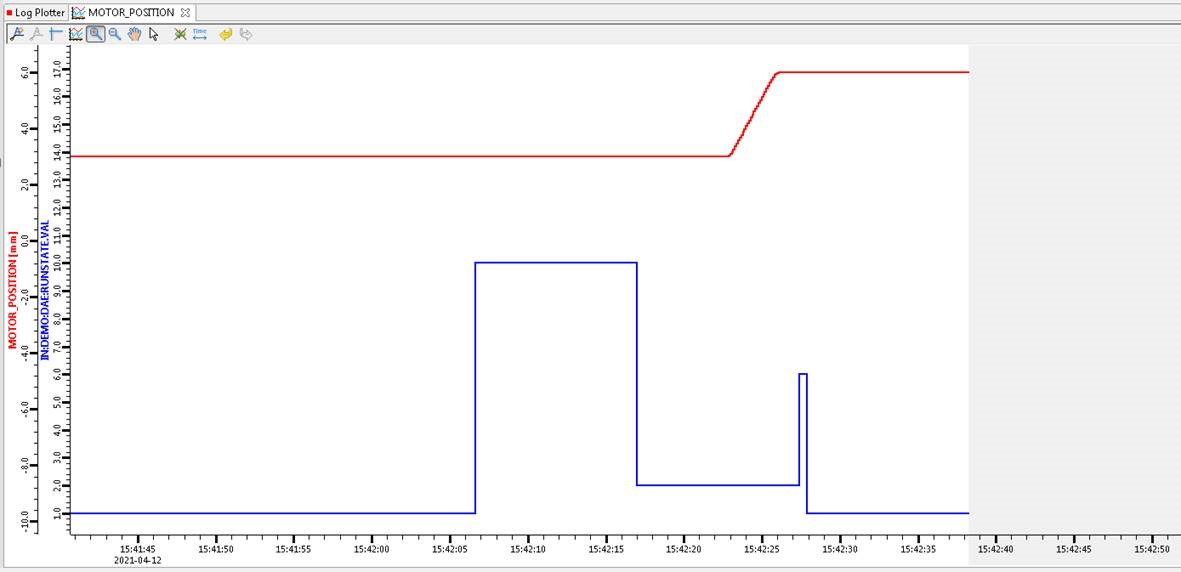
## Acceptance Criteria
* It is easier to plot this information (maybe a checkbox on the log plotter itself or by right clicking on the dashboard)
* The information is easier to interpret, at a minimum we should reduce the states down to just running/not running but ideally scientists would like a shaded area for the running parts (like requested in https://github.com/ISISComputingGroup/IBEX/issues/4738)
* If the shaded area is too hard spin into a new ticket
Guía de contribución
No hay ninguna guía de contribución indexada para este repositorio
Línea de trabajo
Comienza con el Log Plotter existente y el flujo de trabajo de runstate vinculado «Plot a Block Graph». Determina cómo se expone actualmente el estado de ejecución y cómo recibe el plotter los valores de los bloques. Se considerará terminado cuando los usuarios puedan incluir fácilmente en un plot los periodos en ejecución/no ejecución e interpretarlos con claridad; trata las regiones sombreadas como un seguimiento separado si es necesario.
Escrito por el modelo de indexación a partir del texto del issue.
Evaluación
- Área
- data-visualization
- Tipo de issue
- Nueva funcionalidad
- Dificultad
- 4/5
- Tiempo estimado
- 3-5 días
- Estado de actividad
- Estancado
- Claridad
- Bastante claro
- Aptitud para principiantes
- 38/100