CodingTrain / CodingTrain/Toy-Neural-Network-JS
Doodle classification visualization
- Dominant language
- JavaScript
- Stars
- 437
- Forks
- 242
- PR merge metrics
- No merged PRs in 30d
Description
Hello,
I've created simple visualization for doodle classification example. It shows every doodle with coresponding prediction from NN.
Sample screenshot:
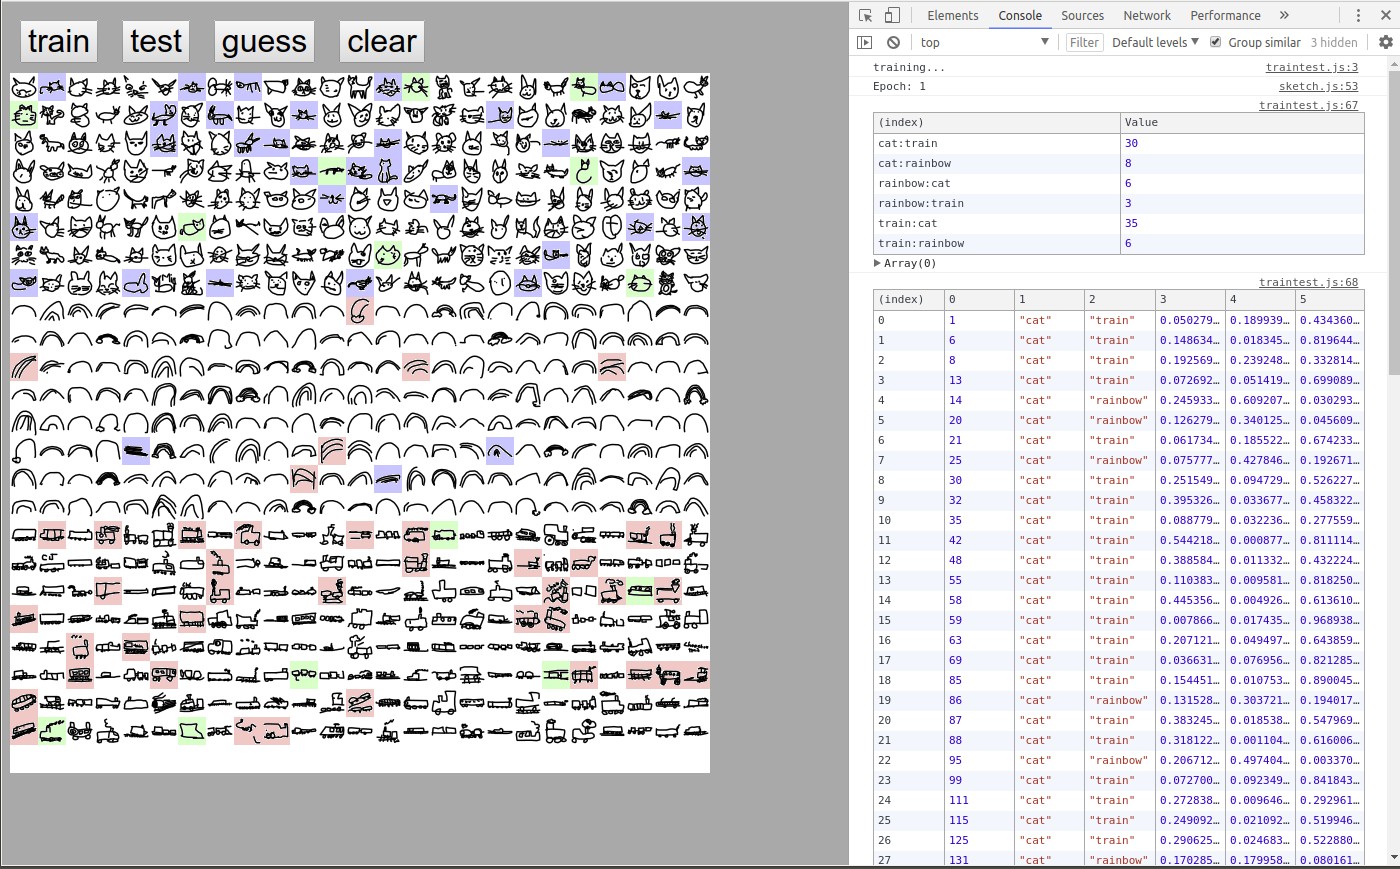
white background = NN was correct
red background = guessed "cat"
green background = guessed "rainbow"
blue background = guessed "train"
In first table in console each row is number of mistakes for every pair label:classification.
Second table is raw list of wrong guesses in format: (index), doodle number, label, classification, guess "cat", guess "rainbow", guess "train".
In overall, looks like NN is pretty consistent with rainbow doodles, but not so much with cats and trains.
Contributor guide
No contributing guide indexed for this repository
Research direction
Start by inspecting the examples/doodle_classification area and the referenced tmp/doodle-screenshot.jpg, then compare the described visualization and console tables with the current example. The issue does not specify whether the visualization should be added, reviewed, or documented, so confirm the intended deliverable before defining what done means.
Written by the indexing model from the issue text.
Assessment
- Tech stack
- javascript
- Domain
- data-visualization, machine-learning
- Issue type
- Feature
- Difficulty
- 3/5
- Estimated time
- 1-2 days
- Activity status
- Stale
- Clarity
- Needs clarification
- Newbie friendliness
- 25/100