plotly / plotly/react-plotly.js
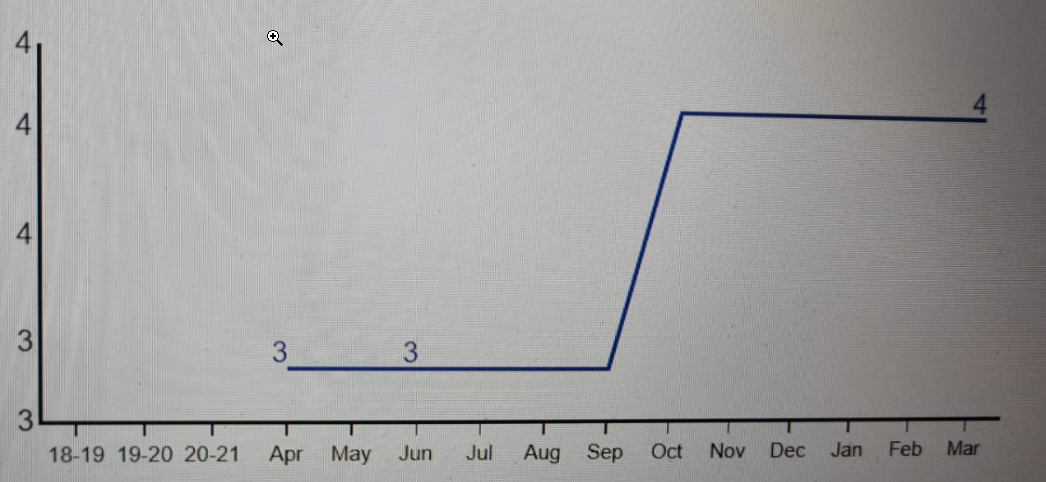
values getting round off and some values is missing in y axis
未關閉
還沒有人認領這個 Issue。
- 主要語言
- JavaScript
- 星號
- 1.1k
- 分支
- 138
- 平均合併
- 3 天 2 小時
- 30 天內合併 PR
- 4
描述
when we took the screen generated in python it's not rounding of values and also 14.6 is visible. but in react version,
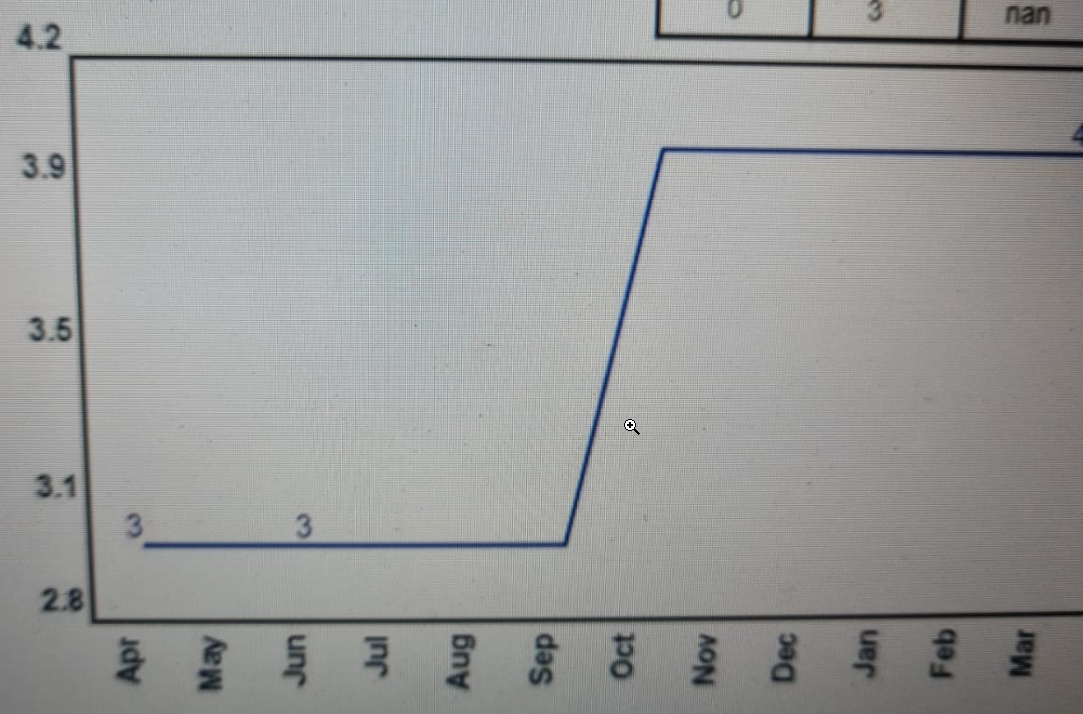
In react version rounding of values and also missing one value itself.
貢獻指南
這個儲存庫沒有索引到貢獻指南
從這裡開始
- 先讀完整個 Issue,再讀專案的貢獻指南。
- 在 Issue 下留言說明你要接手 —— 這能避免兩個人做同樣的事。
- Fork 儲存庫,在一個分支上完成修改。
- 送出 Pull Request,並在描述裡引用這個 Issue 編號。
研究方向
首先重現 Python 產生的圖表與 issue 截圖中顯示的 React 版本之間的差異,重點關注 y 軸刻度的捨入以及缺少的 14.6 值。在相同的資料與設定下,React 圖表顯示預期的未捨入 y 軸值(包括 14.6)時,即表示完成。
由索引模型根據 Issue 內容生成。
評估
- 技術堆疊
- javascript, react
- 領域
- data-visualization, frontend
- Issue 類型
- 缺陷
- 難度
- 3/5
- 預估耗時
- 1-2 天
- 活躍度
- 停滯
- 描述清晰度
- 需要釐清
- 新手友好度
- 35/100