plotly / plotly/react-plotly.js
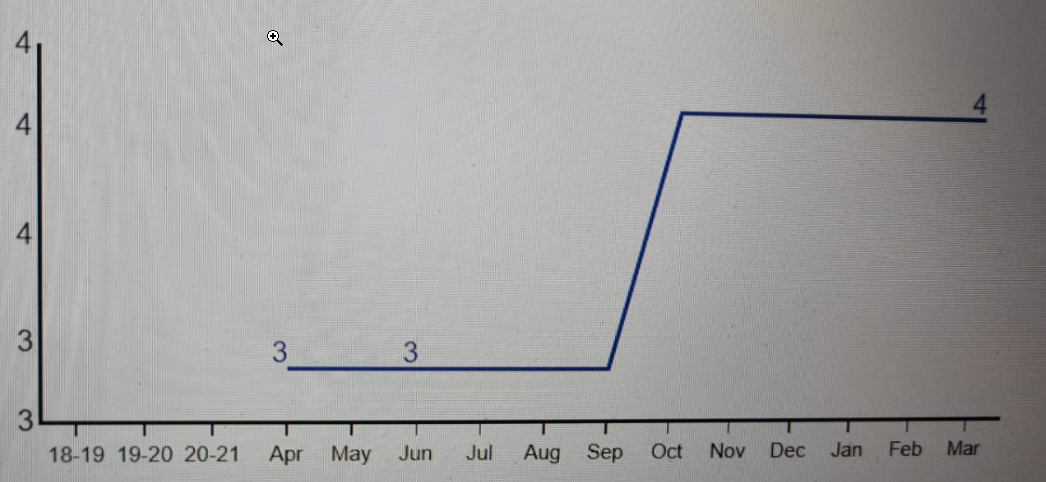
values getting round off and some values is missing in y axis
Open
Nobody has claimed this yet.
- Dominant language
- JavaScript
- Stars
- 1.1k
- Forks
- 138
- Avg merge
- 3d 2h
- Merged PRs (30d)
- 4
Description
when we took the screen generated in python it's not rounding of values and also 14.6 is visible. but in react version,
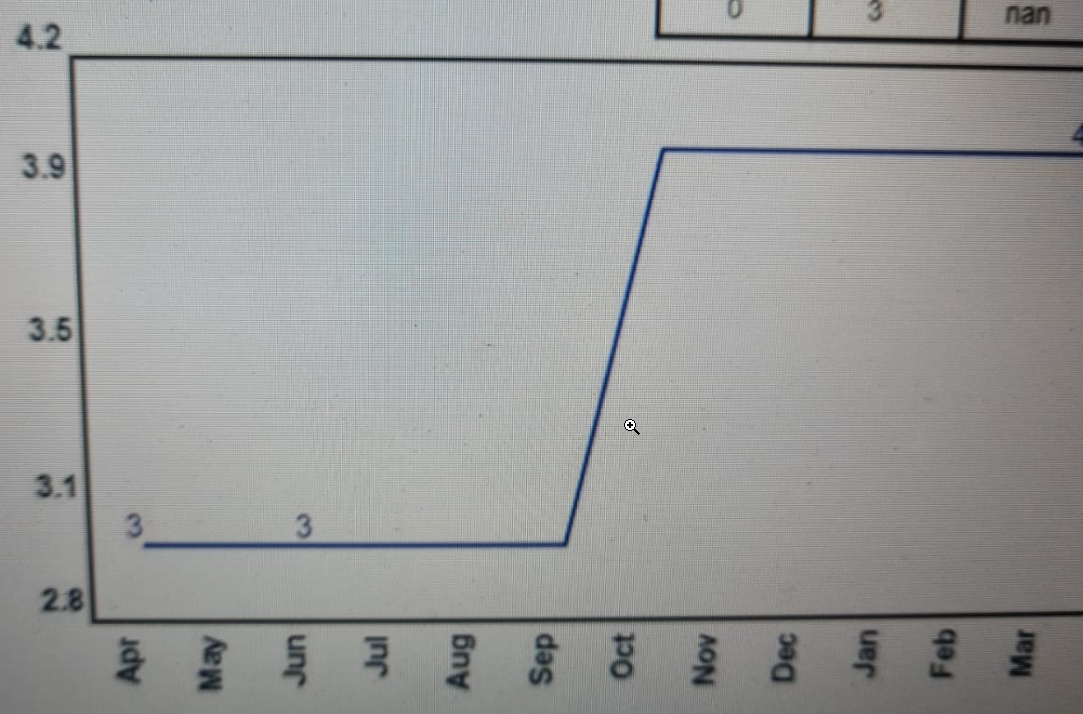
In react version rounding of values and also missing one value itself.
Contributor guide
No contributing guide indexed for this repository
First steps
- Read the whole issue, then the project's contributing guide.
- Comment on the issue to say you are picking it up — it saves two people doing the same work.
- Fork the repository and make your change on a branch.
- Open a pull request that references the issue number.
Research direction
Start by reproducing the discrepancy between the Python-generated chart and the React version shown in the issue screenshots, focusing on y-axis tick rounding and the missing 14.6 value. Done when the React chart displays the expected unrounded y-axis values, including 14.6, under the same data and configuration.
Written by the indexing model from the issue text.
Assessment
- Tech stack
- javascript, react
- Domain
- data-visualization, frontend
- Issue type
- Bug
- Difficulty
- 3/5
- Estimated time
- 1-2 days
- Activity status
- Stale
- Clarity
- Needs clarification
- Newbie friendliness
- 35/100