Sunburst figures not aggregating custom_data for parents with >1 leaf
Open
Nobody has claimed this yet.
bug
P3
- Dominant language
- Python
- Stars
- 18.8k
- Forks
- 2.8k
- Avg merge
- 16h 26m
- Merged PRs (30d)
- 21
Description
Consider the following Sunburst figure:
import pandas as pd
import plotly.express as px

data = [
    ["A", "1", 200.0, 20.0],
    ["A", "2", 100.0, 10.0],
    ["A", "3", 350.0, 35.0],
    ["B", "1", 500.0, 50.0],
    ["C", "1", 20.0, 2.0],
    ["C", "2", 50.0, 5.0],
]
columns = ["Category Group", "Category", "Value", "Additional Value"]
df = pd.DataFrame(data, columns=columns)

fig = px.sunburst(df, path=['Category Group', 'Category'], values='Value', custom_data=['Additional Value'])
fig.update_traces(textinfo="label+percent entry")
fig.update_traces(hovertemplate='<b>%{label}</b><br>Value: $%{value}<br>Additional Value: $%{customdata[0]}<br>')
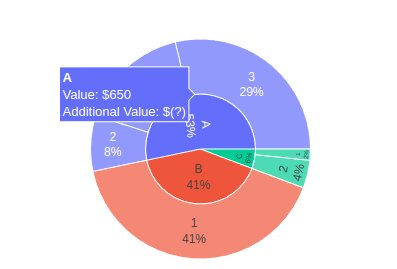
Any parents with >1 leaf do not display the sum of their children for the custom_data field. This behavior is not in line with other fields such as value or color which correctly display the sum of their children
Contributor guide
First steps
- Read the whole issue, then the project's contributing guide.
- Comment on the issue to say you are picking it up — it saves two people doing the same work.
- Fork the repository and make your change on a branch.
- Open a pull request that references the issue number.
Research direction
Reproduce the case with the provided pandas DataFrame and px.sunburst(..., custom_data=...). Trace how parent values are generated for custom_data versus value and color, starting at the px.sunburst entry point and the resulting figure trace. Done means parent customdata displays the sum of its leaf values, including groups A and C, while existing behavior is preserved.
Written by the indexing model from the issue text.
Assessment
- Tech stack
- pandas, plotly, python
- Domain
- data-visualization
- Issue type
- Bug
- Difficulty
- 3/5
- Estimated time
- 1-2 days
- Activity status
- Stale
- Clarity
- Mostly clear
- Newbie friendliness
- 45/100