Violin plot with 'name' attribute set as Datetime gets flattened out
未关闭
还没有人认领这个 Issue。
bug
P3
- 主要语言
- Python
- 星标
- 18.8k
- 派生
- 2.8k
- 平均合并
- 16 小时 26 分钟
- 30 天内合并 PR
- 21
描述
I'm trying to make a horizontally oriented ridge plot . Following is the code
plotly.version == 5.3.1
Ridgeline plot
base_date = dt.datetime.strptime(start_date,'%Y-%m-%d')
fig = go.Figure()

for day in range(days) :
                    offset = dt.timedelta(days=day)
                    date = (base_date + offset).strftime('%Y-%m-%d')
                    violin_plot_data = swData[date]
                    fig.add_trace(go.Violin(x = violin_plot_data.loc[:,metric_name] ,
                                                    orientation = 'h',
                                                    width = 3 ,
                                                    side = 'positive',
                                                    meanline_visible=True,
                                                    points = False
                                                   )
                                         )

fig.show()
I'm getting the following output :

However I wish to set "name" attribute for individual dates . I did the following
Ridgelin plot
base_date = dt.datetime.strptime(start_date,'%Y-%m-%d')
fig = go.Figure()

for day in range(days) :
    offset = dt.timedelta(days=day)
    date = (base_date + offset).strftime('%Y-%m-%d')
    violin_plot_data = swData[date]
    fig.add_trace(go.Violin(x = violin_plot_data.loc[:,metric_name] ,
                                    orientation = 'h',
                                    width = 3 ,
                                    side = 'positive',
                                    name = date,
                                    meanline_visible=True,
                                    points = False
                                   )
                         )
fig.show()
The output that I'm getting is
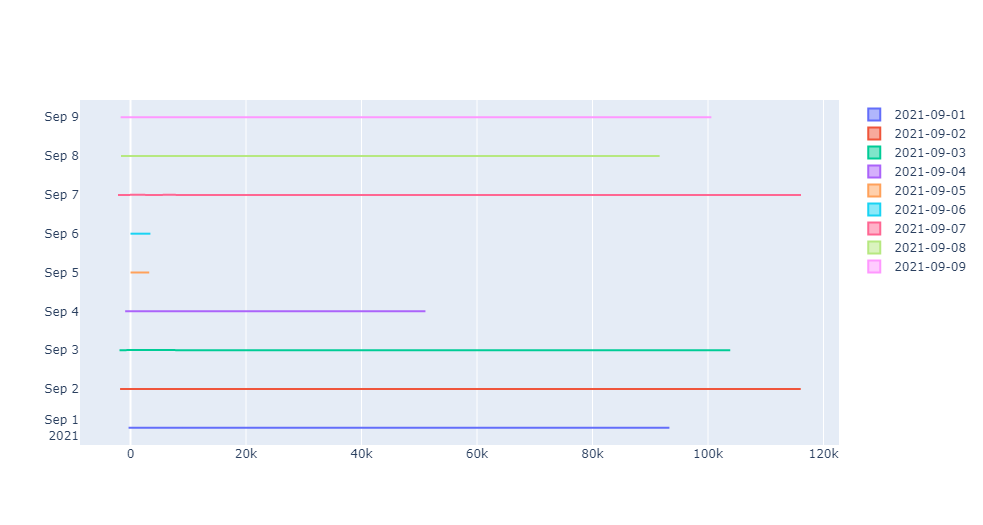
Kindly clarify if it's a bug in the framework or a silly mistake from my side . TY :)
EDIT : I've found a work around and answered it here [https://stackoverflow.com/a/69894008/6571670] but I feel Plotly should be able to parse dates explicitly
贡献指南
从这里开始
- 先读完整个 Issue,再读项目的贡献指南。
- 在 Issue 下留言说明你要接手 —— 这能避免两个人做同样的事。
- Fork 仓库,在一个分支上完成修改。
- 提交 Pull Request,并在描述里引用这个 Issue 编号。
调研方向
使用 Plotly 5.3.1 重现所提供的 ridge-plot 示例,先不传入 datetime 字符串,再将其作为每个 violin trace 的 name 传入。跟踪 violin 名称的解析和渲染方式,然后验证日期标签仍然彼此区分且图表没有被展平;保留报告中的 workaround 作为回归用例。
由索引模型根据 Issue 内容生成。
评估
- 技术栈
- python
- 领域
- data-visualization
- Issue 类型
- 缺陷
- 难度
- 3/5
- 预计耗时
- 1-2 天
- 活跃度
- 活跃
- 描述清晰度
- 基本清楚
- 新手友好度
- 55/100