Violin plot with 'name' attribute set as Datetime gets flattened out
Nadie ha tomado este issue todavía.
- Lenguaje dominante
- Python
- Estrellas
- 18.8k
- Forks
- 2.8k
- Merge medio
- 16 h 26 min
- PR fusionados (30 d)
- 21
Descripción
I'm trying to make a horizontally oriented ridge plot . Following is the code
plotly.version == 5.3.1
Ridgeline plot
base_date = dt.datetime.strptime(start_date,'%Y-%m-%d')
fig = go.Figure()

for day in range(days) :
                    offset = dt.timedelta(days=day)
                    date = (base_date + offset).strftime('%Y-%m-%d')
                    violin_plot_data = swData[date]
                    fig.add_trace(go.Violin(x = violin_plot_data.loc[:,metric_name] ,
                                                    orientation = 'h',
                                                    width = 3 ,
                                                    side = 'positive',
                                                    meanline_visible=True,
                                                    points = False
                                                   )
                                         )

fig.show()
I'm getting the following output :

However I wish to set "name" attribute for individual dates . I did the following
Ridgelin plot
base_date = dt.datetime.strptime(start_date,'%Y-%m-%d')
fig = go.Figure()

for day in range(days) :
    offset = dt.timedelta(days=day)
    date = (base_date + offset).strftime('%Y-%m-%d')
    violin_plot_data = swData[date]
    fig.add_trace(go.Violin(x = violin_plot_data.loc[:,metric_name] ,
                                    orientation = 'h',
                                    width = 3 ,
                                    side = 'positive',
                                    name = date,
                                    meanline_visible=True,
                                    points = False
                                   )
                         )
fig.show()
The output that I'm getting is
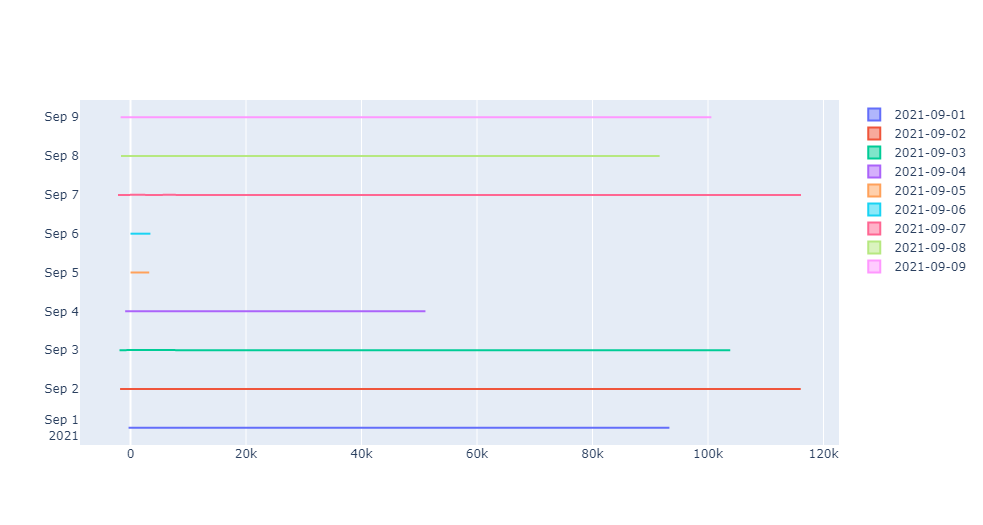
Kindly clarify if it's a bug in the framework or a silly mistake from my side . TY :)
EDIT : I've found a work around and answered it here [https://stackoverflow.com/a/69894008/6571670] but I feel Plotly should be able to parse dates explicitly
Guía de contribución
Primeros pasos
- Lee el issue completo y luego la guía de contribución del proyecto.
- Comenta en el issue que vas a ocuparte — evita que dos personas hagan lo mismo.
- Haz un fork del repositorio y trabaja en una rama.
- Abre un pull request que haga referencia al número del issue.
Línea de trabajo
Reproducir el ejemplo de ridge-plot proporcionado con Plotly 5.3.1, primero sin y después con la cadena datetime pasada como name de cada trace de violín. Rastrear cómo se analizan y renderizan los nombres de los violines y, después, verificar que las etiquetas de fecha sigan siendo distintas y que el gráfico no se aplane; conservar el workaround informado como caso de regresión.
Escrito por el modelo de indexación a partir del texto del issue.
Evaluación
- Stack tecnológico
- python
- Área
- data-visualization
- Tipo de issue
- Error
- Dificultad
- 3/5
- Tiempo estimado
- 1-2 días
- Estado de actividad
- Activo
- Claridad
- Bastante claro
- Aptitud para principiantes
- 55/100