Violin plot with 'name' attribute set as Datetime gets flattened out
Nobody has claimed this yet.
- Dominant language
- Python
- Stars
- 18.8k
- Forks
- 2.8k
- Avg merge
- 16h 26m
- Merged PRs (30d)
- 21
Description
I'm trying to make a horizontally oriented ridge plot . Following is the code
plotly.version == 5.3.1
Ridgeline plot
base_date = dt.datetime.strptime(start_date,'%Y-%m-%d')
fig = go.Figure()

for day in range(days) :
                    offset = dt.timedelta(days=day)
                    date = (base_date + offset).strftime('%Y-%m-%d')
                    violin_plot_data = swData[date]
                    fig.add_trace(go.Violin(x = violin_plot_data.loc[:,metric_name] ,
                                                    orientation = 'h',
                                                    width = 3 ,
                                                    side = 'positive',
                                                    meanline_visible=True,
                                                    points = False
                                                   )
                                         )

fig.show()
I'm getting the following output :

However I wish to set "name" attribute for individual dates . I did the following
Ridgelin plot
base_date = dt.datetime.strptime(start_date,'%Y-%m-%d')
fig = go.Figure()

for day in range(days) :
    offset = dt.timedelta(days=day)
    date = (base_date + offset).strftime('%Y-%m-%d')
    violin_plot_data = swData[date]
    fig.add_trace(go.Violin(x = violin_plot_data.loc[:,metric_name] ,
                                    orientation = 'h',
                                    width = 3 ,
                                    side = 'positive',
                                    name = date,
                                    meanline_visible=True,
                                    points = False
                                   )
                         )
fig.show()
The output that I'm getting is
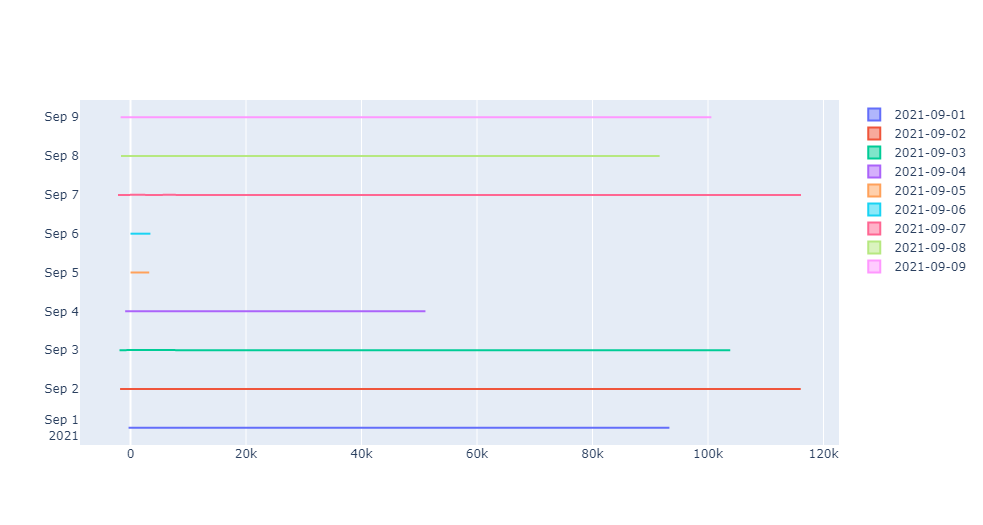
Kindly clarify if it's a bug in the framework or a silly mistake from my side . TY :)
EDIT : I've found a work around and answered it here [https://stackoverflow.com/a/69894008/6571670] but I feel Plotly should be able to parse dates explicitly
Contributor guide
First steps
- Read the whole issue, then the project's contributing guide.
- Comment on the issue to say you are picking it up — it saves two people doing the same work.
- Fork the repository and make your change on a branch.
- Open a pull request that references the issue number.
Research direction
Reproduce the supplied ridge-plot example with Plotly 5.3.1, first without and then with the datetime string passed as each violin trace's name. Trace how violin names are parsed and rendered, then verify that date labels remain distinct and the plot is not flattened; preserve the reported workaround as a regression case.
Written by the indexing model from the issue text.
Assessment
- Tech stack
- python
- Domain
- data-visualization
- Issue type
- Bug
- Difficulty
- 3/5
- Estimated time
- 1-2 days
- Activity status
- Active
- Clarity
- Mostly clear
- Newbie friendliness
- 55/100