Difference in NaNs in hover values between figure and figure widget
未关闭
还没有人认领这个 Issue。
bug
P3
- 主要语言
- Python
- 星标
- 18.8k
- 派生
- 2.8k
- 平均合并
- 16 小时 26 分钟
- 30 天内合并 PR
- 21
描述
Nans are labeled as 0.0 when using figure, but correctly as NaN when using FigureWidget.
Minimal reproducible example .
import numpy as np
import plotly.graph_objects as go

x = np.random.random(10)
y = np.random.random(10)
color = np.ones(10)*np.nan

fig = go.Figure(
    data=go.Scatter(
        x=x,
        y=y,
        marker=dict(
            size=16, #set color equal to a variable
            colorscale='Viridis', # one of plotly colorscales
            showscale=True,
            color=color
        ),
        mode='markers',
        hoverinfo="text",
        hovertemplate="x=%{x:.3f}<br>y=%{y:.3f}<br>%{marker.color:.3f}"
    )
)
fig

go.FigureWidget(fig)
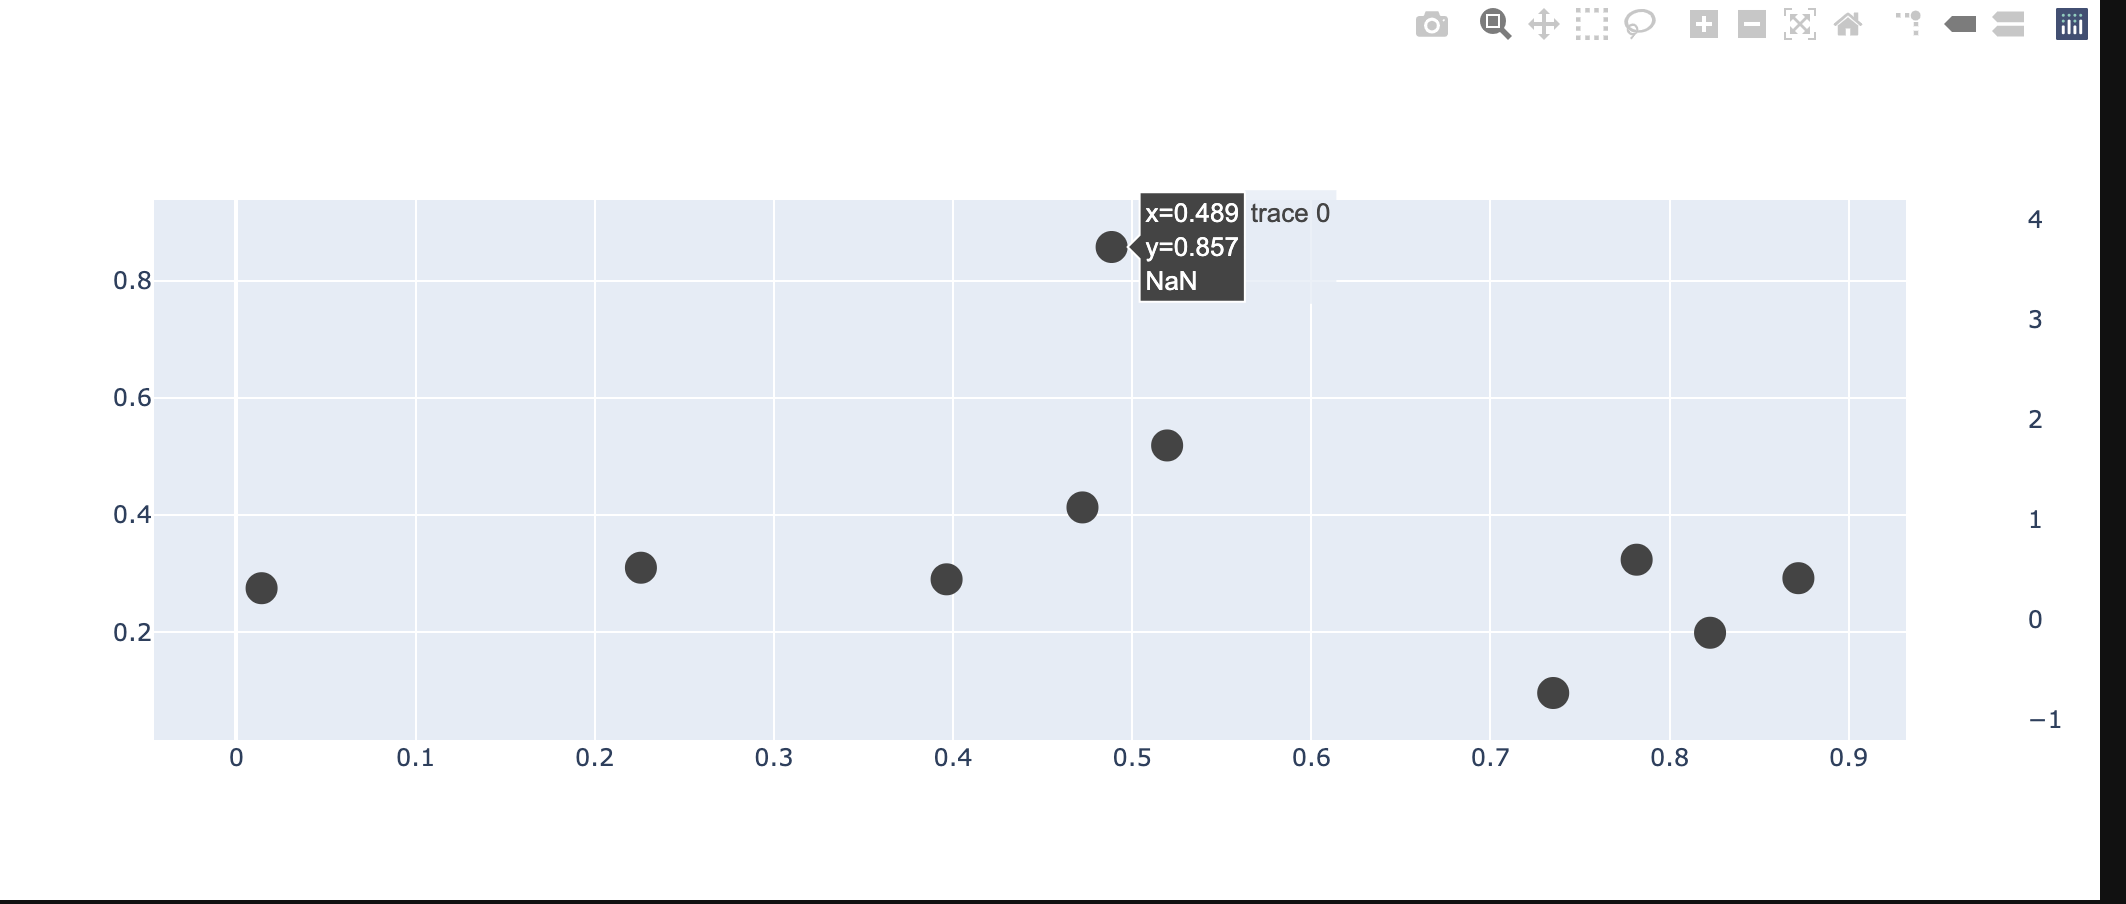
贡献指南
从这里开始
- 先读完整个 Issue,再读项目的贡献指南。
- 在 Issue 下留言说明你要接手 —— 这能避免两个人做同样的事。
- Fork 仓库,在一个分支上完成修改。
- 提交 Pull Request,并在描述里引用这个 Issue 编号。
调研方向
首先分别使用 go.Figure 和 go.FigureWidget 运行最小可复现示例,比较 marker.color 包含 NaN 时生成的 hover 值。跟踪不同的 hover 值处理方式,并在两种 figure 类型都在 hovertemplate 中一致显示 NaN 时验证完成情况。
由索引模型根据 Issue 内容生成。
评估
- 技术栈
- numpy, plotly, python
- 领域
- data-visualization
- Issue 类型
- 缺陷
- 难度
- 3/5
- 预计耗时
- 1-2 天
- 活跃度
- 停滞
- 描述清晰度
- 基本清楚
- 新手友好度
- 35/100