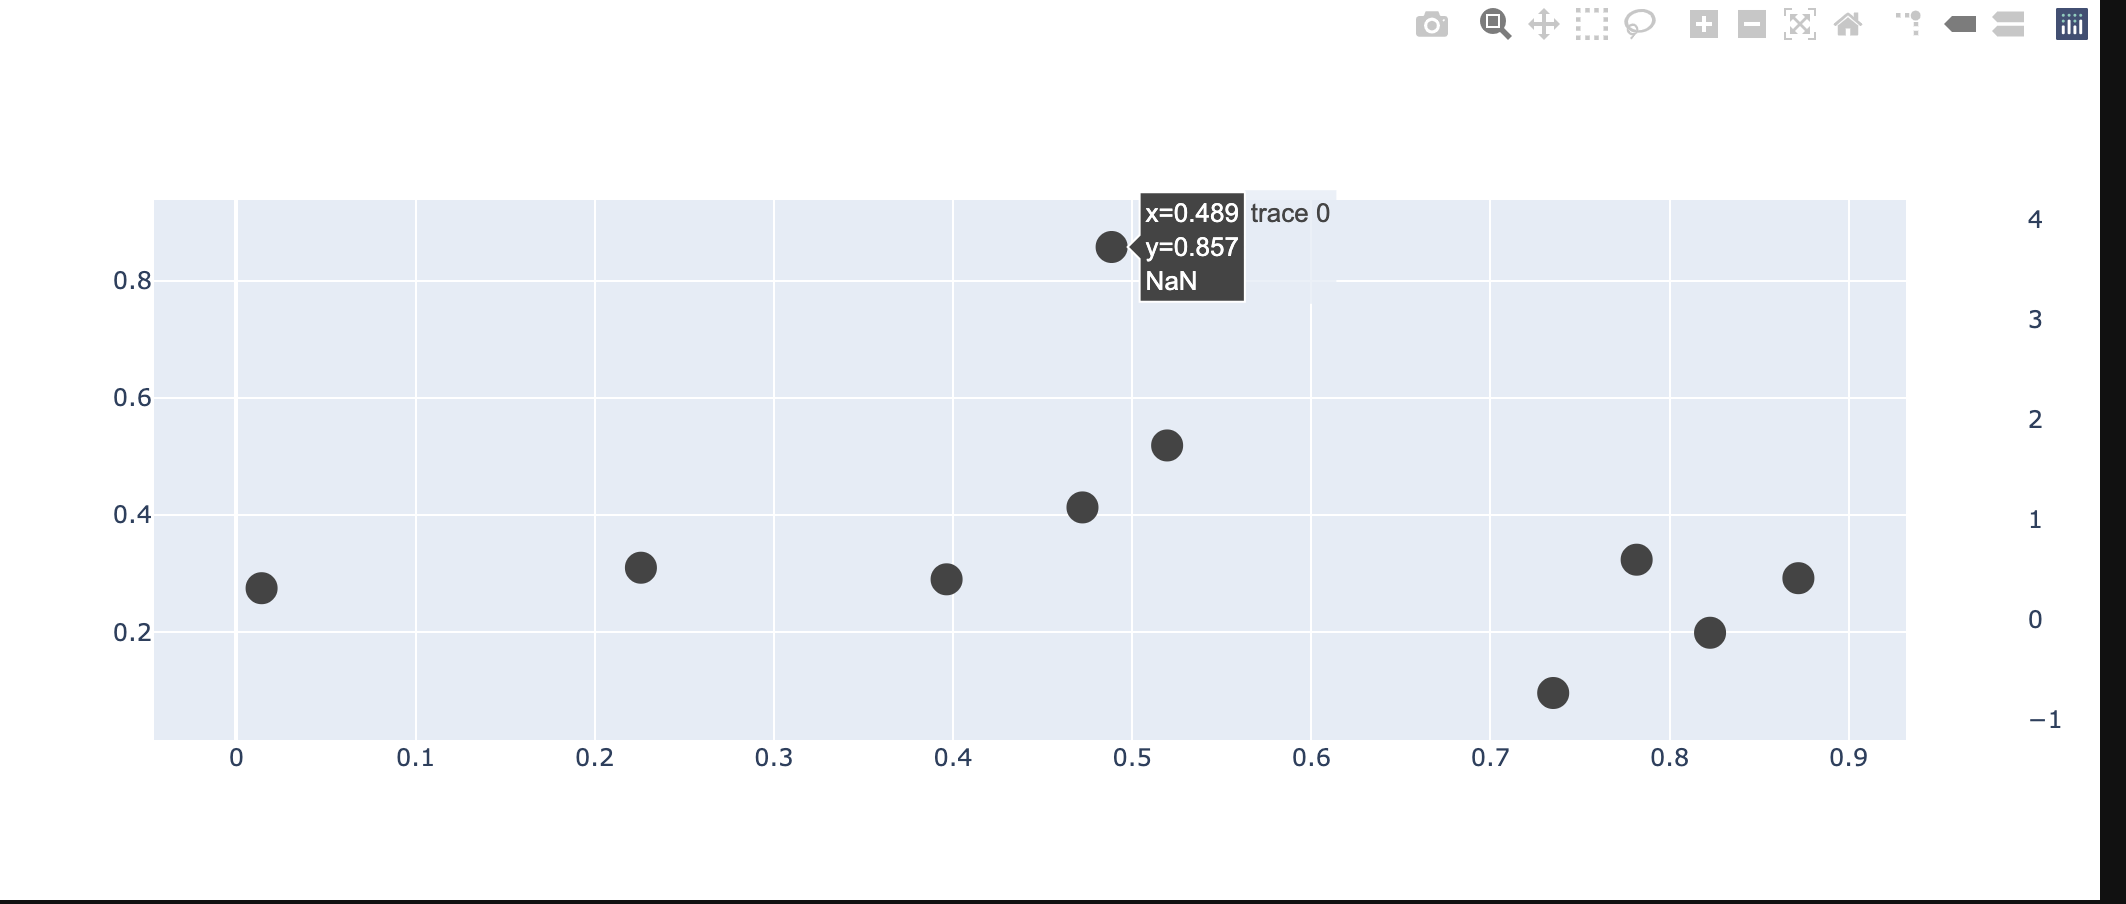
Difference in NaNs in hover values between figure and figure widget
Open
Nobody has claimed this yet.
bug
P3
- Dominant language
- Python
- Stars
- 18.8k
- Forks
- 2.8k
- Avg merge
- 16h 26m
- Merged PRs (30d)
- 21
Description
Nans are labeled as 0.0 when using figure, but correctly as NaN when using FigureWidget.
Minimal reproducible example .
import numpy as np
import plotly.graph_objects as go

x = np.random.random(10)
y = np.random.random(10)
color = np.ones(10)*np.nan

fig = go.Figure(
    data=go.Scatter(
        x=x,
        y=y,
        marker=dict(
            size=16, #set color equal to a variable
            colorscale='Viridis', # one of plotly colorscales
            showscale=True,
            color=color
        ),
        mode='markers',
        hoverinfo="text",
        hovertemplate="x=%{x:.3f}<br>y=%{y:.3f}<br>%{marker.color:.3f}"
    )
)
fig

go.FigureWidget(fig)
Contributor guide
First steps
- Read the whole issue, then the project's contributing guide.
- Comment on the issue to say you are picking it up — it saves two people doing the same work.
- Fork the repository and make your change on a branch.
- Open a pull request that references the issue number.
Research direction
Start by running the minimal reproducible example with both go.Figure and go.FigureWidget, comparing the generated hover values for marker.color containing NaN. Trace the differing hover-value handling and verify completion when both figure types display NaN consistently in the hovertemplate.
Written by the indexing model from the issue text.
Assessment
- Tech stack
- numpy, plotly, python
- Domain
- data-visualization
- Issue type
- Bug
- Difficulty
- 3/5
- Estimated time
- 1-2 days
- Activity status
- Stale
- Clarity
- Mostly clear
- Newbie friendliness
- 35/100