Text scaling bugs when using dynamic CSS transform and content-editable after clicking on the plot
Nobody has claimed this yet.
- Dominant language
- JavaScript
- Stars
- 18.3k
- Forks
- 2k
- Avg merge
- 2d 12h
- Merged PRs (30d)
- 28
Description
Hi, this is a reproducible bug that we have run into in our charts. Unfortunately, this only happens on Chrome browsers which the majority of our users are using.
When using a dynamic zoom level control for scaling, there is unexplainable sizing issues with the annotations on the plot. For whatever reason, this occurs after clicking on the chart.
I have attached a minimal reproducible example with steps:
https://codepen.io/woon2222/pen/XWxRKjN
I am not sure why this occurs when the content-editable element is present.
Here is a video of what happens:
5440e09e-1b8e-4148-9183-0546966f0f62.webm
And some screenshots:
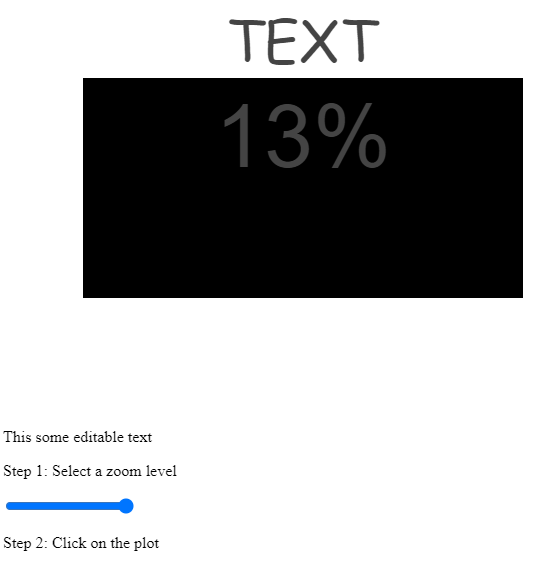

Perhaps someone could shed some light on this or has a workaround that we could use.
Contributor guide
First steps
- Read the whole issue, then the project's contributing guide.
- Comment on the issue to say you are picking it up — it saves two people doing the same work.
- Fork the repository and make your change on a branch.
- Open a pull request that references the issue number.
Research direction
Start by reproducing the issue from the linked CodePen in Chrome, following the dynamic zoom, chart click, CSS transform, and content-editable interactions. Trace how the chart updates annotation sizing after the click and compare behavior with and without the content-editable element. Done means annotations retain the expected size after clicking the plot.
Written by the indexing model from the issue text.
Assessment
- Tech stack
- css, javascript
- Domain
- data-visualization, frontend
- Issue type
- Bug
- Difficulty
- 4/5
- Estimated time
- 3-5 days
- Activity status
- Stale
- Clarity
- Needs clarification
- Newbie friendliness
- 25/100