ggplotly does not preserve arrows created using geom_segment
未關閉
還沒有人認領這個 Issue。
- 主要語言
- R
- 星號
- 2.7k
- 分支
- 641
- PR 合併指標
- 30 天內沒有已合併 PR
描述
If I plot arrows using geom_segment() in ggplot and then convert the plot with ggplotly, the line segment is preserved as expected but the arrows are not. See example below:
Before: We have line segments and arrows.
library(ggplot)
df2 <- expand.grid(
  lineend = c('round', 'butt', 'square'),
  linejoin = c('round', 'mitre', 'bevel'),
  stringsAsFactors = FALSE
)
df2 <- data.frame(df2, y = 1:9)
p <- ggplot(df2, aes(x = 1, y = y, xend = 2, yend = y, label = paste(lineend, linejoin))) +
  geom_segment(
    lineend = df2$lineend, linejoin = df2$linejoin,
    size = 3, arrow = arrow(length = unit(0.3, "inches"))
  ) +
  geom_text(hjust = 'outside', nudge_x = -0.2) +
  xlim(0.5, 2)
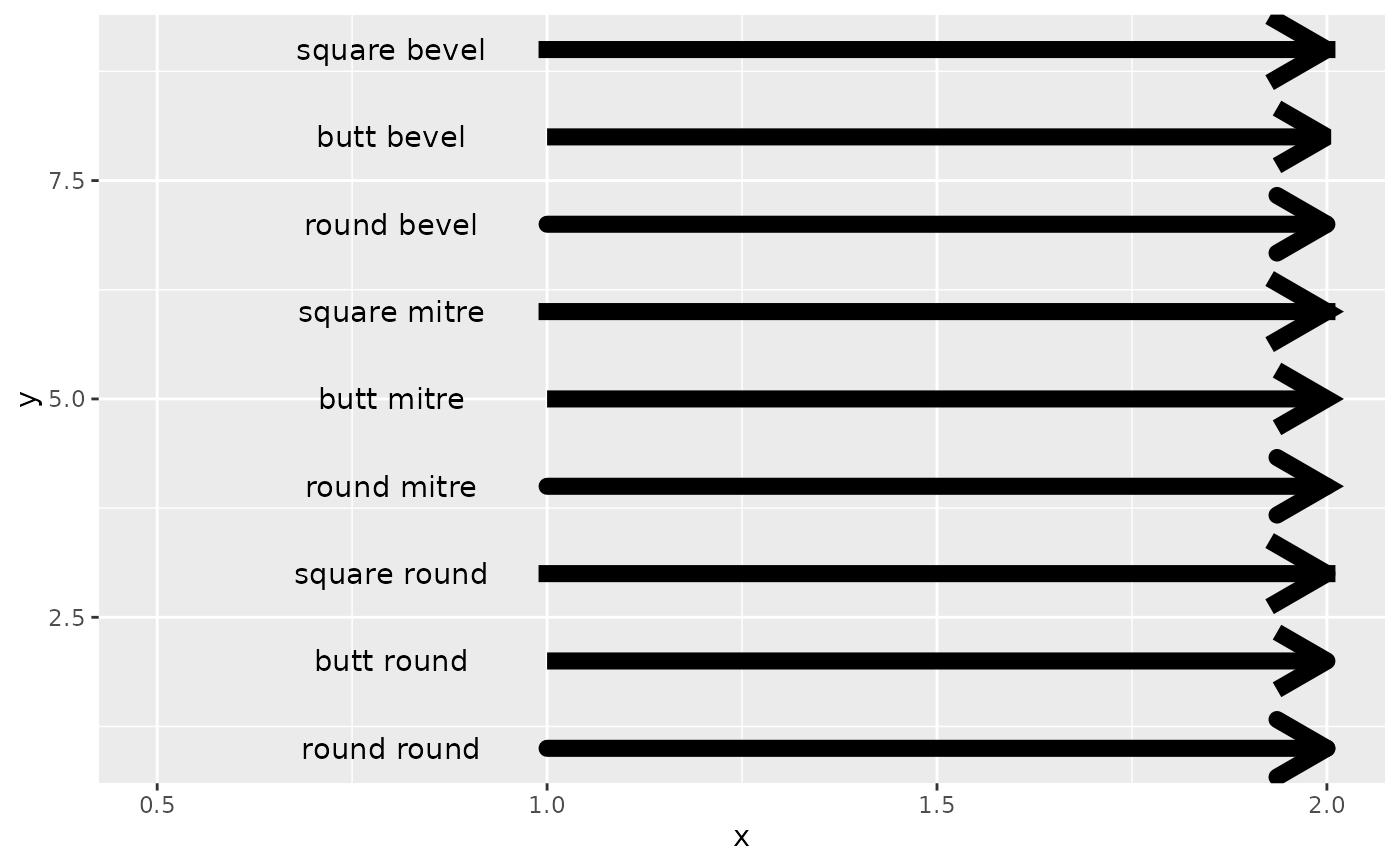
After: We have line segments but NO arrows.
ggplotly(p)

貢獻指南
從這裡開始
- 先讀完整個 Issue,再讀專案的貢獻指南。
- 在 Issue 下留言說明你要接手 —— 這能避免兩個人做同樣的事。
- Fork 儲存庫,在一個分支上完成修改。
- 送出 Pull Request,並在描述裡引用這個 Issue 編號。
研究方向
首先執行提供的 R 範例,使用 geom_segment() 和 ggplotly() 重現缺少的箭頭。追蹤 ggplotly 如何轉換 geom_segment 圖層,接著確認轉換後的繪圖同時保留箭頭和線段。
由索引模型根據 Issue 內容生成。
評估
- 技術堆疊
- r
- 領域
- data-visualization
- Issue 類型
- 缺陷
- 難度
- 4/5
- 預估耗時
- 3-5 天
- 活躍度
- 停滯
- 描述清晰度
- 基本清楚
- 新手友好度
- 42/100