FR: add a root_color option for treemap traces
未關閉
還沒有人認領這個 Issue。
- 主要語言
- R
- 星號
- 2.7k
- 分支
- 641
- PR 合併指標
- 30 天內沒有已合併 PR
描述
When using a colorscale on a treemap trace (without providing a root) the container is shown in black:
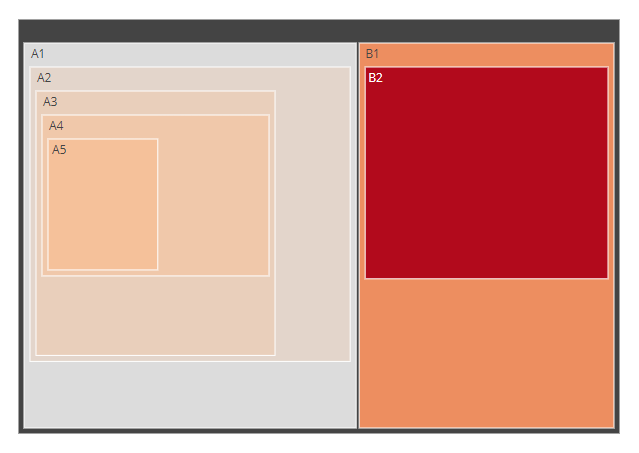
library(plotly)

labels = c("A1", "A2", "A3", "A4", "A5", "B1", "B2")
parents = c("", "A1", "A2", "A3", "A4", "", "B1")
values = c("11", "12", "13", "14", "15", "20", "30")

fig <- plot_ly(
  type="treemap",
  labels=labels,
  parents=parents,
  values=values,
  marker=list(colorscale='Reds'))

fig
Example taken from here: https://plotly.com/r/treemaps/
I'd like to change it to white.
In the python plotly library there is a root_color argument to do so:
fig.update_traces(root_color="lightgrey")
see: https://plotly.com/python/treemaps/
It would be great to have the same option in R.
Or is there any workaround to achive this?
貢獻指南
從這裡開始
- 先讀完整個 Issue,再讀專案的貢獻指南。
- 在 Issue 下留言說明你要接手 —— 這能避免兩個人做同樣的事。
- Fork 儲存庫,在一個分支上完成修改。
- 送出 Pull Request,並在描述裡引用這個 Issue 編號。
研究方向
從使用 labels、parents、values 和 marker colorscale 的 R treemap 範例開始,然後將其行為與 Python 的 update_traces(root_color="lightgrey") 範例進行比較。當 R treemap API 接受等效的 root 顏色選項,並在未提供 root 的情況下變更容器的顏色時,這項工作就完成了。
由索引模型根據 Issue 內容生成。
評估
- 技術堆疊
- r
- 領域
- data-visualization
- Issue 類型
- 功能
- 難度
- 3/5
- 預估耗時
- 1-2 天
- 活躍度
- 停滯
- 描述清晰度
- 基本清楚
- 新手友好度
- 35/100