FR: add a root_color option for treemap traces
Dieses Issue hat noch niemand übernommen.
- Vorherrschende Sprache
- R
- Sterne
- 2.7k
- Forks
- 641
- PR-Merge-Kennzahlen
- Keine gemergten PRs in 30 T.
Beschreibung
When using a colorscale on a treemap trace (without providing a root) the container is shown in black:
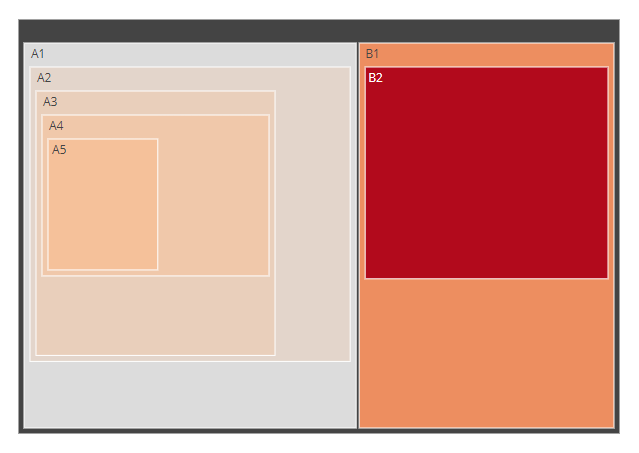
library(plotly)

labels = c("A1", "A2", "A3", "A4", "A5", "B1", "B2")
parents = c("", "A1", "A2", "A3", "A4", "", "B1")
values = c("11", "12", "13", "14", "15", "20", "30")

fig <- plot_ly(
  type="treemap",
  labels=labels,
  parents=parents,
  values=values,
  marker=list(colorscale='Reds'))

fig
Example taken from here: https://plotly.com/r/treemaps/
I'd like to change it to white.
In the python plotly library there is a root_color argument to do so:
fig.update_traces(root_color="lightgrey")
see: https://plotly.com/python/treemaps/
It would be great to have the same option in R.
Or is there any workaround to achive this?
Beitragsleitfaden
Erste Schritte
- Lies das ganze Issue und danach den Beitragsleitfaden des Projekts.
- Schreib ins Issue, dass du es übernimmst — das erspart doppelte Arbeit.
- Forke das Repository und arbeite in einem Branch.
- Öffne einen Pull Request, der die Issue-Nummer nennt.
Rechercherichtung
Beginne mit dem R-Treemap-Beispiel mit labels, parents, values und marker colorscale und vergleiche anschließend sein Verhalten mit dem Python-Beispiel update_traces(root_color="lightgrey"). Die Arbeit ist abgeschlossen, wenn die R-Treemap-API eine entsprechende Root-Farboption akzeptiert und die Farbe des Containers ohne einen angegebenen Root ändert.
Vom Indexierungsmodell aus dem Issue-Text verfasst.
Bewertung
- Tech-Stack
- r
- Bereich
- data-visualization
- Issue-Typ
- Feature
- Schwierigkeit
- 3/5
- Geschätzter Aufwand
- 1-2 Tage
- Aktivitätsstatus
- Veraltet
- Klarheit
- Größtenteils klar
- Anfängerfreundlichkeit
- 35/100