FR: add a root_color option for treemap traces
Nobody has claimed this yet.
- Dominant language
- R
- Stars
- 2.7k
- Forks
- 641
- PR merge metrics
- No merged PRs in 30d
Description
When using a colorscale on a treemap trace (without providing a root) the container is shown in black:
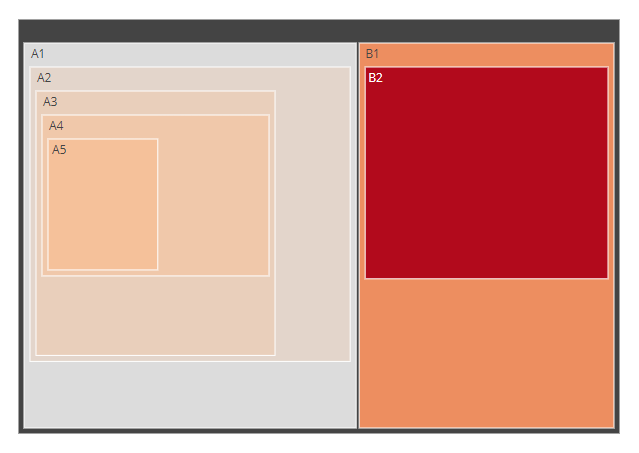
library(plotly)

labels = c("A1", "A2", "A3", "A4", "A5", "B1", "B2")
parents = c("", "A1", "A2", "A3", "A4", "", "B1")
values = c("11", "12", "13", "14", "15", "20", "30")

fig <- plot_ly(
  type="treemap",
  labels=labels,
  parents=parents,
  values=values,
  marker=list(colorscale='Reds'))

fig
Example taken from here: https://plotly.com/r/treemaps/
I'd like to change it to white.
In the python plotly library there is a root_color argument to do so:
fig.update_traces(root_color="lightgrey")
see: https://plotly.com/python/treemaps/
It would be great to have the same option in R.
Or is there any workaround to achive this?
Contributor guide
First steps
- Read the whole issue, then the project's contributing guide.
- Comment on the issue to say you are picking it up — it saves two people doing the same work.
- Fork the repository and make your change on a branch.
- Open a pull request that references the issue number.
Research direction
Start with the R treemap example using labels, parents, values, and marker colorscale, then compare its behavior with Python's update_traces(root_color="lightgrey") example. The work is done when the R treemap API accepts an equivalent root color option and changes the color of the container without a supplied root.
Written by the indexing model from the issue text.
Assessment
- Tech stack
- r
- Domain
- data-visualization
- Issue type
- Feature
- Difficulty
- 3/5
- Estimated time
- 1-2 days
- Activity status
- Stale
- Clarity
- Mostly clear
- Newbie friendliness
- 35/100