2d and 3d plots overlap when using 'subplot' -- previous solution doesn't work for plots with more than one rows
Nobody has claimed this yet.
- Dominant language
- R
- Stars
- 2.7k
- Forks
- 641
- PR merge metrics
- No merged PRs in 30d
Description
I met a similar issue to the one posted at 2d and 3d plots overlap when using 'subplot' #579, namely the plots do not align as expected with subplot(). The author of that issue put a solution there, but I found that the solution only works with plots with one row, but doesn't work with plots with several rows. For example:
p1 = plot_ly(x = 1, y = 1)
p2 = plot_ly(x = 1, y = 1, z = 1, type = "scatter3d")
subplot(p1, p2, nrows = 2) %>% layout(scene = list(domain = list(x = c(0, 1), y = c(0.5, 1))))
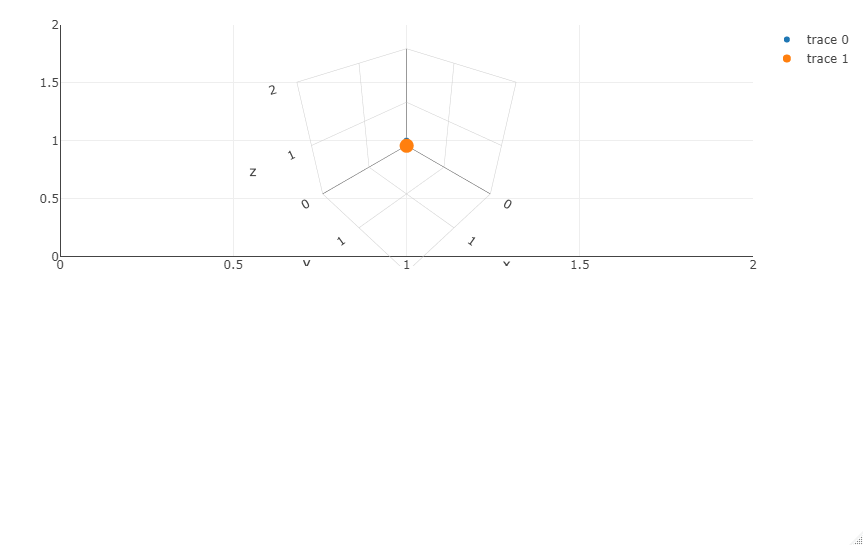
Is that a bug in the package? And are there possible workarounds? Thanks in advance for following this issue.
Contributor guide
First steps
- Read the whole issue, then the project's contributing guide.
- Comment on the issue to say you are picking it up — it saves two people doing the same work.
- Fork the repository and make your change on a branch.
- Open a pull request that references the issue number.
Research direction
Start by running the supplied R reproducer using plot_ly(), subplot(), nrows = 2, and layout(scene = ...). Read the subplot() handling for mixed 2D and 3D plots across multiple rows and compare it with the linked issue’s one-row solution. Done means the plots no longer overlap for the reported multi-row case, or the supported workaround is documented.
Written by the indexing model from the issue text.
Assessment
- Tech stack
- r
- Domain
- data-visualization
- Issue type
- Bug
- Difficulty
- 4/5
- Estimated time
- 3-5 days
- Activity status
- Stale
- Clarity
- Mostly clear
- Newbie friendliness
- 35/100