[R-plotly] Hovertemplate fails in violin plot
オープン
まだ誰も着手していません。
- 主要言語
- R
- スター
- 2.7k
- フォーク
- 641
- PR マージ指標
- 30日以内にマージされた PR はありません
説明
I attempt to use the hovertemplate argument to format the hover text, but it cannot properly display.
However the argument works for type = "scatter". Similar issue was found in #1636 with box plot.
df <- tibble(x = sample(letters[1:3], 100, replace = T), y = rnorm(100))
df %>% plot_ly(
  x = ~x,
  y = ~y,
  split = ~x,
  type = 'violin',
  box = list(
    visible = TRUE
  ),
  hovertemplate = "%{y}", # not work
  hoveron = "kde",
  jitter = 1,
  alpha = 0.5,
  spanmode = "hard"
  )
)
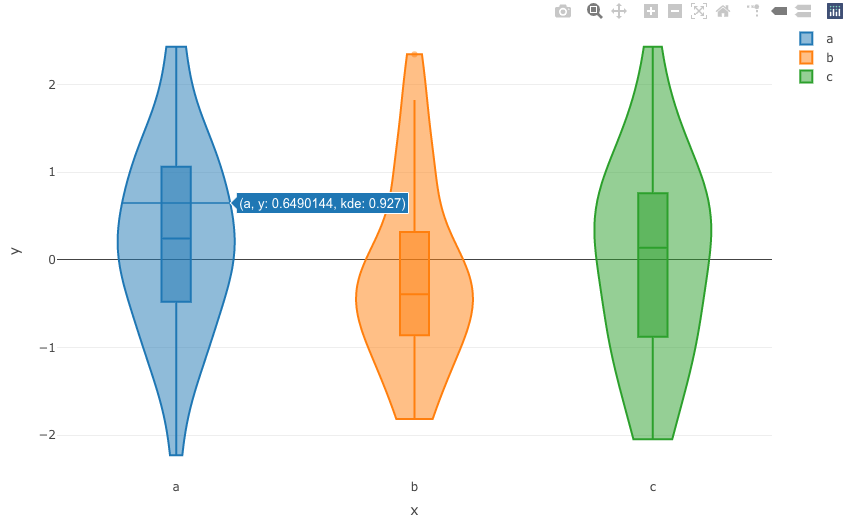
Using text argument + hoverinfo will let the hover disappear completely
df %>% plot_ly(
  x = ~x,
  y = ~y,
  split = ~x,
  text = ~y, # using text argument
  type = 'violin',
  box = list(
    visible = TRUE
  ),
  hoverinfo = "text", # with hoverinfo
  hoveron = "kde",
  jitter = 1,
  alpha = 0.5,
  spanmode = "hard"
  )
)
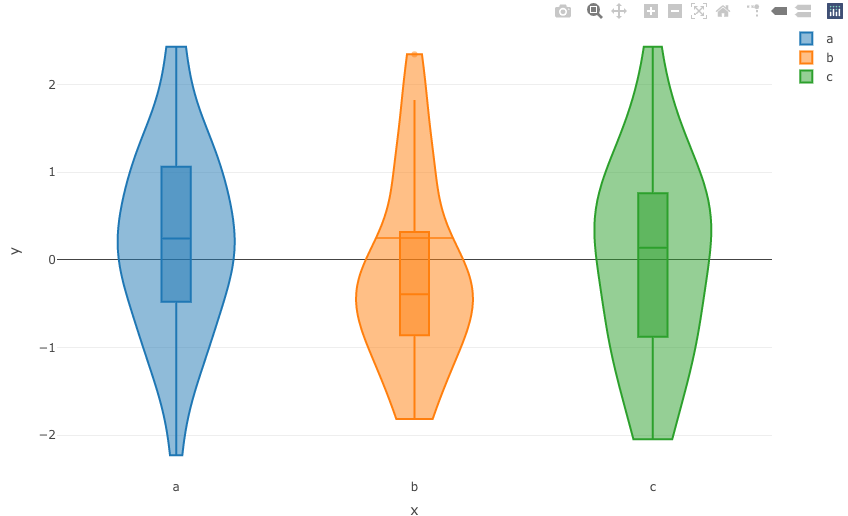
Using hoverinfo = "y" comes along with kde
df %>% plot_ly(
  x = ~x,
  y = ~y,
  split = ~x,
  type = 'violin',
  box = list(
    visible = TRUE
  ),
  hoverinfo = "y",
  hoveron = "kde",
  jitter = 1,
  alpha = 0.5,
  spanmode = "hard"
  )

However, hoverinfo = "x" works properly,
df %>% plot_ly(
  x = ~x,
  y = ~y,
  split = ~x,
  type = 'violin',
  box = list(
    visible = TRUE
  ),
  hoverinfo = "x",
  hoveron = "kde",
  jitter = 1,
  alpha = 0.5,
  spanmode = "hard"
  )

R version = 4.0.5, R-plotly version = 4.9.3
コントリビューションガイド
はじめの一歩
- issue を最後まで読み、次にプロジェクトのコントリビューションガイドを読みます。
- 着手することを issue にコメントします — 二人が同じ作業をするのを防げます。
- リポジトリをフォークし、ブランチを切って変更します。
- issue 番号を参照したプルリクエストを送ります。
調査の方向性
提供された R のバイオリンプロットの例を再現し、その hover 動作を、動作している散布図のケースおよび関連するボックスプロットの issue #1636 と比較します。R の例から関連する plotly.R のエントリポイントまでバイオリンの hover 処理を追跡します。hovertemplate と hoverinfo が要求された y テキストを表示し、KDE の hover 情報を失わない状態になれば完了です。
索引モデルが issue の本文から書いたものです。
評価
- 技術スタック
- r
- 領域
- data-visualization
- issue の種類
- バグ
- 難易度
- 3/5
- 見積もり時間
- 1〜2日
- 活発さ
- 停滞
- 明瞭さ
- おおむね明確
- 初心者へのやさしさ
- 38/100