Plotly in R. How to remove annotation based on the legend. The data points are still there when the legend is hidden.
まだ誰も着手していません。
- 主要言語
- R
- スター
- 2.7k
- フォーク
- 641
- PR マージ指標
- 30日以内にマージされた PR はありません
説明
Is there a way to remove the numbers when removing the line graph. It should display the correct data annotation when the particular legend is selected
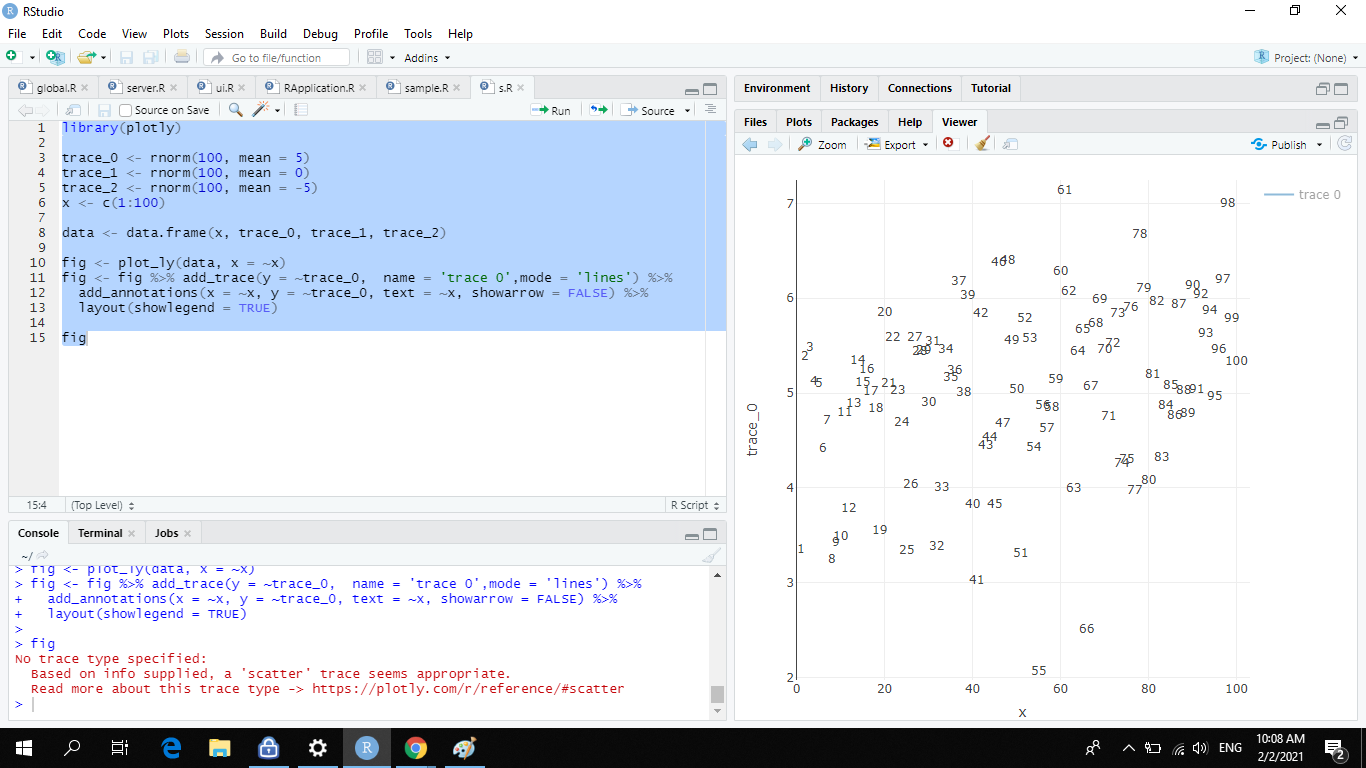
library(plotly)
trace_0 <- rnorm(100, mean = 5)
trace_1 <- rnorm(100, mean = 0)
trace_2 <- rnorm(100, mean = -5)
x <- c(1:100)
data <- data.frame(x, trace_0, trace_1, trace_2)
fig <- plot_ly(data, x = ~x)
fig <- fig %>% add_trace(y = ~trace_0, name = 'trace 0',mode = 'lines') %>%
add_annotations(x = ~x, y = ~trace_0, text = ~x, showarrow = FALSE) %>%
layout(showlegend = TRUE)
fig
コントリビューションガイド
はじめの一歩
- issue を最後まで読み、次にプロジェクトのコントリビューションガイドを読みます。
- 着手することを issue にコメントします — 二人が同じ作業をするのを防げます。
- リポジトリをフォークし、ブランチを切って変更します。
- issue 番号を参照したプルリクエストを送ります。
調査の方向性
提供された R の例を plotly で使用して動作を再現し、add_trace()、add_annotations()、および凡例の表示状態に焦点を当てます。アノテーションの表示状態が選択された trace にどのように従うべきかを判断し、そのうえで、凡例の項目を非表示にするとそのアノテーションも非表示になり、表示されている trace に対して正しいアノテーションが維持されることを検証します。
索引モデルが issue の本文から書いたものです。
評価
- 技術スタック
- r
- 領域
- data-visualization
- issue の種類
- バグ
- 難易度
- 4/5
- 見積もり時間
- 3〜5日
- 活発さ
- 停滞
- 明瞭さ
- おおむね明確
- 初心者へのやさしさ
- 25/100