matplotlib / matplotlib/basemap
Why is matplotlib basemap not plotting the colours of some areas in my map?
还没有人认领这个 Issue。
- 主要语言
- Python
- 星标
- 817
- 派生
- 395
- PR 合并指标
- 30 天内没有已合并 PR
描述
The code below is supposed to colour all the states of Vietnam:
import pandas as pd
import matplotlib.pyplot as plt
from mpl_toolkits.basemap import Basemap

fig, ax = plt.subplots(figsize=(10,20))

# create the map
map = Basemap(resolution='l', # c, l, i, h, f or None
            projection='merc',
            lat_0=15.95, lon_0=105.85,
            llcrnrlon=102., llcrnrlat= 8.31, urcrnrlon=109.69, urcrnrlat=23.61)


# load the shapefile, use the name 'states'
map.readshapefile(r'path\to\gadm36_VNM_1', name='states', drawbounds=True)
# shapefile downloaded from http://www.gadm.org/


# collect the state names from the shapefile attributes so we can
# look up the shape obect for a state by it's name
state_names = []
for shape_dict in map.states_info:
    state_names.append(shape_dict['VARNAME_1'])

ax = plt.gca() # get current axes instance


# NOR, CEN, SOU and MEK are some subdivisions I have created for the states of Vietnam

NOR = ['Lai Chau',
'Lao Cai',
'Ha Giang',
'Cao Bang',
'Dien Bien',
'Son La',
'Yen Bai',
'Tuyen Quang',
'Bac Kan',
'Lang Son',
'Thai Nguyen',
'Phu Tho',
'Vinh Phuc',
'Hoa Binh',
'Ha Noi',
'Bac Ninh',
'Hai Duong',
'Hung Yen',
'Ha Nam',
'Quang Ninh',
'Hai Phong',
'Thai Binh',
'Nam Dinh',
'Bac Giang',
'Ninh Binh']


CEN = ['Thanh Hoa',
      'Nghe An',
      'Ha Tinh',
      'Quang Binh',
      'Quang Tri',
      'Thua Thien Hue',
      'Da Nang']


SOU = ['Quang Nam',
      'Kon Tum',
      'Quang Ngai',
      'Gia Lai',
      'Binh Dinh',
      'Dak Lak',
      'Phu Yen',
      'Khanh Hoa',
      'Dak Nong',
      'Lam Dong',
      'Ninh Thuan']


MEK = ['Binh Phuoc',
      'Dong Nai',
      'Binh Thuan',
      'Tay Ninh',
      'Binh Duong',
      'Dong Nai',
      'Ba Ria - Vung Tau',
      'Ho Chi Minh',
      'Long An',
      'An Giang',
      'Dong Thap',
      'Tien Giang',
      'Kien Giang',
      'Can Tho',
      'Vinh Long',
      'Ben Tre',
      'Hau Giang',
      'Tra Vinh',
      'Soc Trang',
      'Bac Lieu',
      'Ca Mau']


# Define the colours to be used to colour the states

from matplotlib import cm
from numpy import linspace

start = 0.5
stop = 1.0
number_of_lines= 4
cm_subsection = linspace(start, stop, number_of_lines)

cm_subsection[0] = cm_subsection[0]*4
cm_subsection[1] = cm_subsection[1]*0.6
cm_subsection[2] = cm_subsection[2]*0.8
cm_subsection[3] = cm_subsection[3]*0.1

colors = [ cm.Blues(x) for x in cm_subsection ]


for state in NOR:
    seg = map.states[state_names.index(state)]
    poly = Polygon(seg, facecolor=colors[0], edgecolor=colors[0])
    ax.add_patch(poly)

for state in CEN:
    seg = map.states[state_names.index(state)]
    poly = Polygon(seg, facecolor=colors[1], edgecolor=colors[1])
    ax.add_patch(poly)

for state in SOU:
    seg = map.states[state_names.index(state)]
    poly = Polygon(seg, facecolor=colors[2], edgecolor=colors[2])
    ax.add_patch(poly)

for state in MEK:
    seg = map.states[state_names.index(state)]
    poly = Polygon(seg, facecolor=colors[3], edgecolor=colors[3])
    ax.add_patch(poly)


import matplotlib.patches as mpatches

NOR_patch = mpatches.Patch(color=colors[0], label='Rate: 34.85%')
CEN_patch = mpatches.Patch(color=colors[1], label='Rate: 25.61%')
SOU_patch = mpatches.Patch(color=colors[2], label='Rate: 32.66%')
MEK_patch = mpatches.Patch(color=colors[3], label='Rate: 20.02%')
plt.legend(handles=[NOR_patch, CEN_patch, SOU_patch, MEK_patch])
plt.show()
But this produces the map below, where some of the states are not coloured even though they are present in the state names and in the subdivisions:

In fact, if I try to colour a state whose name is not present in the lists, it throws an error:
MEK.append('ABCDE')

---------------------------------------------------------------------------
ValueError                                Traceback (most recent call last)
<ipython-input-619-a89da62a0831> in <module>()
    134
    135 for state in MEK:
--> 136     seg = map.states[state_names.index(state)]
    137     poly = Polygon(seg, facecolor=colors[3], edgecolor=colors[3])
    138     ax.add_patch(poly)

ValueError: 'ABCDE' is not in list
So, clearly the states that are not colored are present in the list, as I'm not getting any error. So, what's going on?
EDIT: It just struck me that almost all the states that aren’t coloured share at least some part of their border with sea/ocean in the real world. The 6 exceptions are highlighted in red below:

Now that’s very interesting! Could it have anything to do with the issue? If yes, what? And why? And why do those 6 exceptions exist?
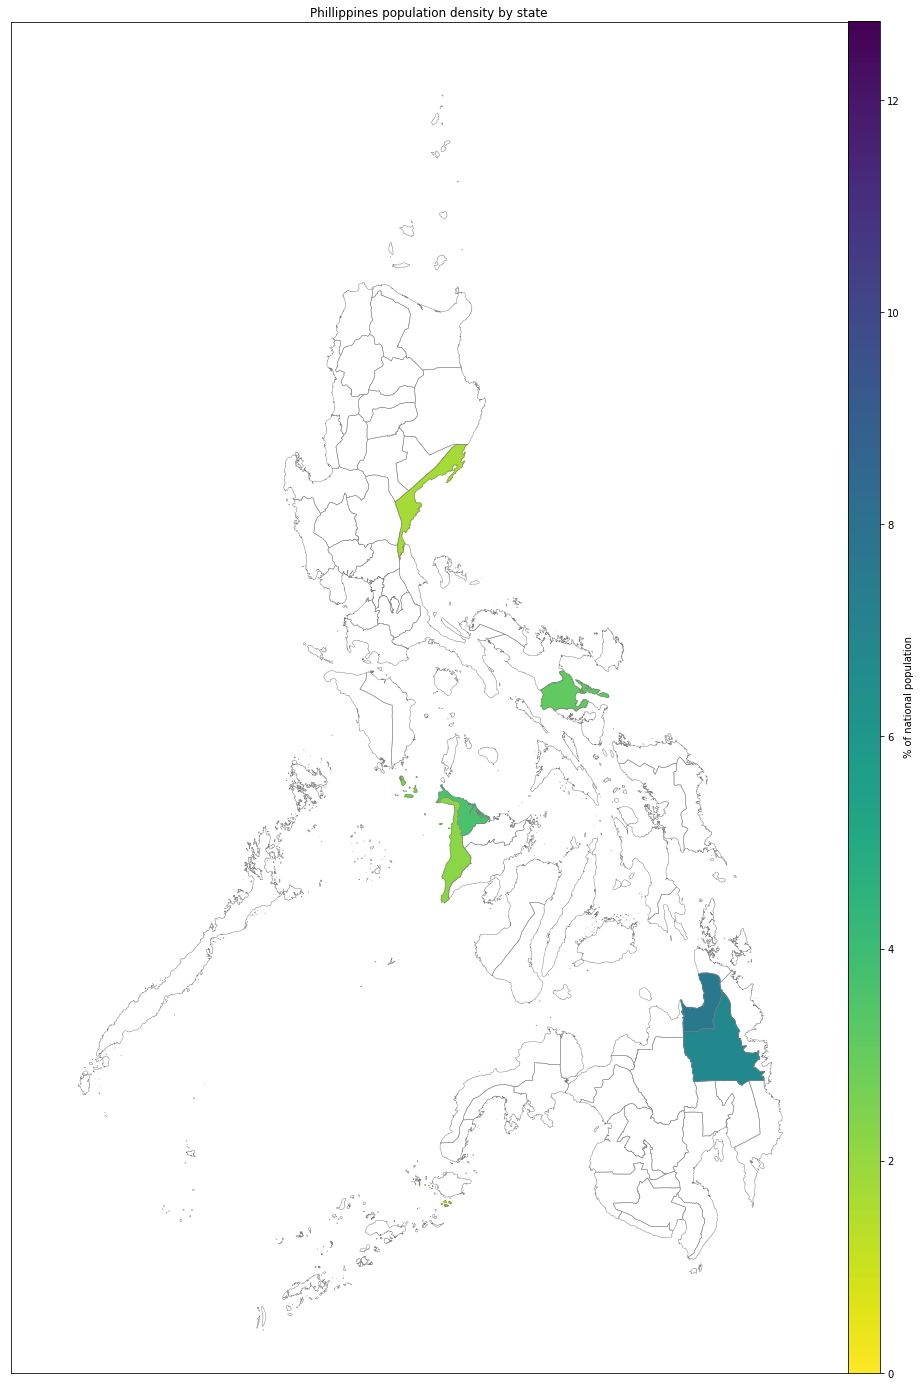
EDIT 2: I have also found similar results when plotting the map of Philippines:
贡献指南
这个仓库没有索引到贡献指南
从这里开始
- 先读完整个 Issue,再读项目的贡献指南。
- 在 Issue 下留言说明你要接手 —— 这能避免两个人做同样的事。
- Fork 仓库,在一个分支上完成修改。
- 提交 Pull Request,并在描述里引用这个 Issue 编号。
调研方向
从 map.readshapefile 调用开始,检查受影响区域对应的 map.states 和 map.states_info 条目。重现 Vietnam 和 Philippines 示例,然后将 shapefile 几何图形与添加到 axes 的 Polygon 补丁进行比较。完成的标准是确定受影响区域为何没有被可见地填充,并记录可复现的修正方案或明确的 upstream 解释。
由索引模型根据 Issue 内容生成。
评估
- 技术栈
- python
- 领域
- data-visualization
- Issue 类型
- 缺陷
- 难度
- 4/5
- 预计耗时
- 3-5 天
- 活跃度
- 停滞
- 描述清晰度
- 基本清楚
- 新手友好度
- 28/100