matplotlib / matplotlib/basemap
Why is matplotlib basemap not plotting the colours of some areas in my map?
Personne n'a encore pris cette issue.
- Langage dominant
- Python
- Étoiles
- 817
- Forks
- 395
- Métriques de merge des PR
- Aucune PR mergée en 30 j
Description
The code below is supposed to colour all the states of Vietnam:
import pandas as pd
import matplotlib.pyplot as plt
from mpl_toolkits.basemap import Basemap

fig, ax = plt.subplots(figsize=(10,20))

# create the map
map = Basemap(resolution='l', # c, l, i, h, f or None
            projection='merc',
            lat_0=15.95, lon_0=105.85,
            llcrnrlon=102., llcrnrlat= 8.31, urcrnrlon=109.69, urcrnrlat=23.61)


# load the shapefile, use the name 'states'
map.readshapefile(r'path\to\gadm36_VNM_1', name='states', drawbounds=True)
# shapefile downloaded from http://www.gadm.org/


# collect the state names from the shapefile attributes so we can
# look up the shape obect for a state by it's name
state_names = []
for shape_dict in map.states_info:
    state_names.append(shape_dict['VARNAME_1'])

ax = plt.gca() # get current axes instance


# NOR, CEN, SOU and MEK are some subdivisions I have created for the states of Vietnam

NOR = ['Lai Chau',
'Lao Cai',
'Ha Giang',
'Cao Bang',
'Dien Bien',
'Son La',
'Yen Bai',
'Tuyen Quang',
'Bac Kan',
'Lang Son',
'Thai Nguyen',
'Phu Tho',
'Vinh Phuc',
'Hoa Binh',
'Ha Noi',
'Bac Ninh',
'Hai Duong',
'Hung Yen',
'Ha Nam',
'Quang Ninh',
'Hai Phong',
'Thai Binh',
'Nam Dinh',
'Bac Giang',
'Ninh Binh']


CEN = ['Thanh Hoa',
      'Nghe An',
      'Ha Tinh',
      'Quang Binh',
      'Quang Tri',
      'Thua Thien Hue',
      'Da Nang']


SOU = ['Quang Nam',
      'Kon Tum',
      'Quang Ngai',
      'Gia Lai',
      'Binh Dinh',
      'Dak Lak',
      'Phu Yen',
      'Khanh Hoa',
      'Dak Nong',
      'Lam Dong',
      'Ninh Thuan']


MEK = ['Binh Phuoc',
      'Dong Nai',
      'Binh Thuan',
      'Tay Ninh',
      'Binh Duong',
      'Dong Nai',
      'Ba Ria - Vung Tau',
      'Ho Chi Minh',
      'Long An',
      'An Giang',
      'Dong Thap',
      'Tien Giang',
      'Kien Giang',
      'Can Tho',
      'Vinh Long',
      'Ben Tre',
      'Hau Giang',
      'Tra Vinh',
      'Soc Trang',
      'Bac Lieu',
      'Ca Mau']


# Define the colours to be used to colour the states

from matplotlib import cm
from numpy import linspace

start = 0.5
stop = 1.0
number_of_lines= 4
cm_subsection = linspace(start, stop, number_of_lines)

cm_subsection[0] = cm_subsection[0]*4
cm_subsection[1] = cm_subsection[1]*0.6
cm_subsection[2] = cm_subsection[2]*0.8
cm_subsection[3] = cm_subsection[3]*0.1

colors = [ cm.Blues(x) for x in cm_subsection ]


for state in NOR:
    seg = map.states[state_names.index(state)]
    poly = Polygon(seg, facecolor=colors[0], edgecolor=colors[0])
    ax.add_patch(poly)

for state in CEN:
    seg = map.states[state_names.index(state)]
    poly = Polygon(seg, facecolor=colors[1], edgecolor=colors[1])
    ax.add_patch(poly)

for state in SOU:
    seg = map.states[state_names.index(state)]
    poly = Polygon(seg, facecolor=colors[2], edgecolor=colors[2])
    ax.add_patch(poly)

for state in MEK:
    seg = map.states[state_names.index(state)]
    poly = Polygon(seg, facecolor=colors[3], edgecolor=colors[3])
    ax.add_patch(poly)


import matplotlib.patches as mpatches

NOR_patch = mpatches.Patch(color=colors[0], label='Rate: 34.85%')
CEN_patch = mpatches.Patch(color=colors[1], label='Rate: 25.61%')
SOU_patch = mpatches.Patch(color=colors[2], label='Rate: 32.66%')
MEK_patch = mpatches.Patch(color=colors[3], label='Rate: 20.02%')
plt.legend(handles=[NOR_patch, CEN_patch, SOU_patch, MEK_patch])
plt.show()
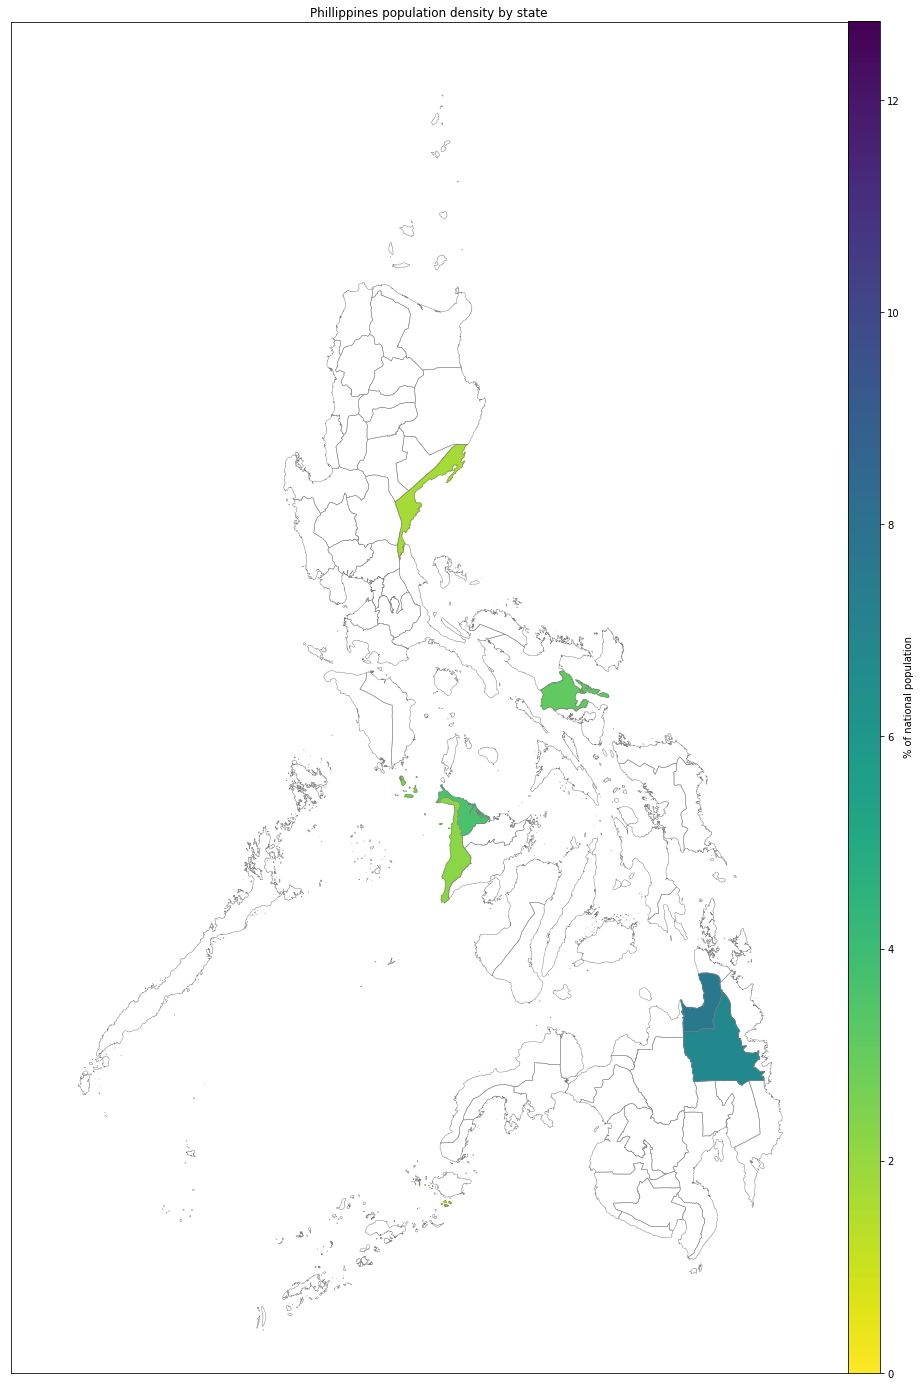
But this produces the map below, where some of the states are not coloured even though they are present in the state names and in the subdivisions:

In fact, if I try to colour a state whose name is not present in the lists, it throws an error:
MEK.append('ABCDE')

---------------------------------------------------------------------------
ValueError                                Traceback (most recent call last)
<ipython-input-619-a89da62a0831> in <module>()
    134
    135 for state in MEK:
--> 136     seg = map.states[state_names.index(state)]
    137     poly = Polygon(seg, facecolor=colors[3], edgecolor=colors[3])
    138     ax.add_patch(poly)

ValueError: 'ABCDE' is not in list
So, clearly the states that are not colored are present in the list, as I'm not getting any error. So, what's going on?
EDIT: It just struck me that almost all the states that aren’t coloured share at least some part of their border with sea/ocean in the real world. The 6 exceptions are highlighted in red below:

Now that’s very interesting! Could it have anything to do with the issue? If yes, what? And why? And why do those 6 exceptions exist?
EDIT 2: I have also found similar results when plotting the map of Philippines:
Guide de contribution
Aucun guide de contribution indexé pour ce dépôt
Par où commencer
- Lisez l'issue en entier, puis le guide de contribution du projet.
- Signalez en commentaire que vous la prenez — cela évite que deux personnes fassent le même travail.
- Forkez le dépôt et travaillez sur une branche.
- Ouvrez une pull request qui référence le numéro de l'issue.
Piste de recherche
Commencez par l'appel map.readshapefile et examinez les entrées map.states et map.states_info résultantes pour les régions concernées. Reproduisez les exemples du Vietnam et des Philippines, puis comparez les géométries du shapefile avec les patches Polygon ajoutés aux axes. Le travail est terminé lorsque vous avez identifié pourquoi les régions concernées ne sont pas remplies visiblement et documenté une correction reproductible ou une explication claire en amont.
Rédigé par le modèle d'indexation à partir du texte de l'issue.
Évaluation
- Stack technique
- python
- Domaine
- data-visualization
- Type d'issue
- Bug
- Difficulté
- 4/5
- Temps estimé
- 3-5 jours
- Activité
- À l'abandon
- Clarté
- Plutôt claire
- Accessibilité débutants
- 28/100