InsightSoftwareConsortium / InsightSoftwareConsortium/itkwidgets
Gaps in colormap map to black when intensity range is really broad
- 主要言語
- Python
- スター
- 624
- フォーク
- 83
- PR マージ指標
- 30日以内にマージされた PR はありません
説明
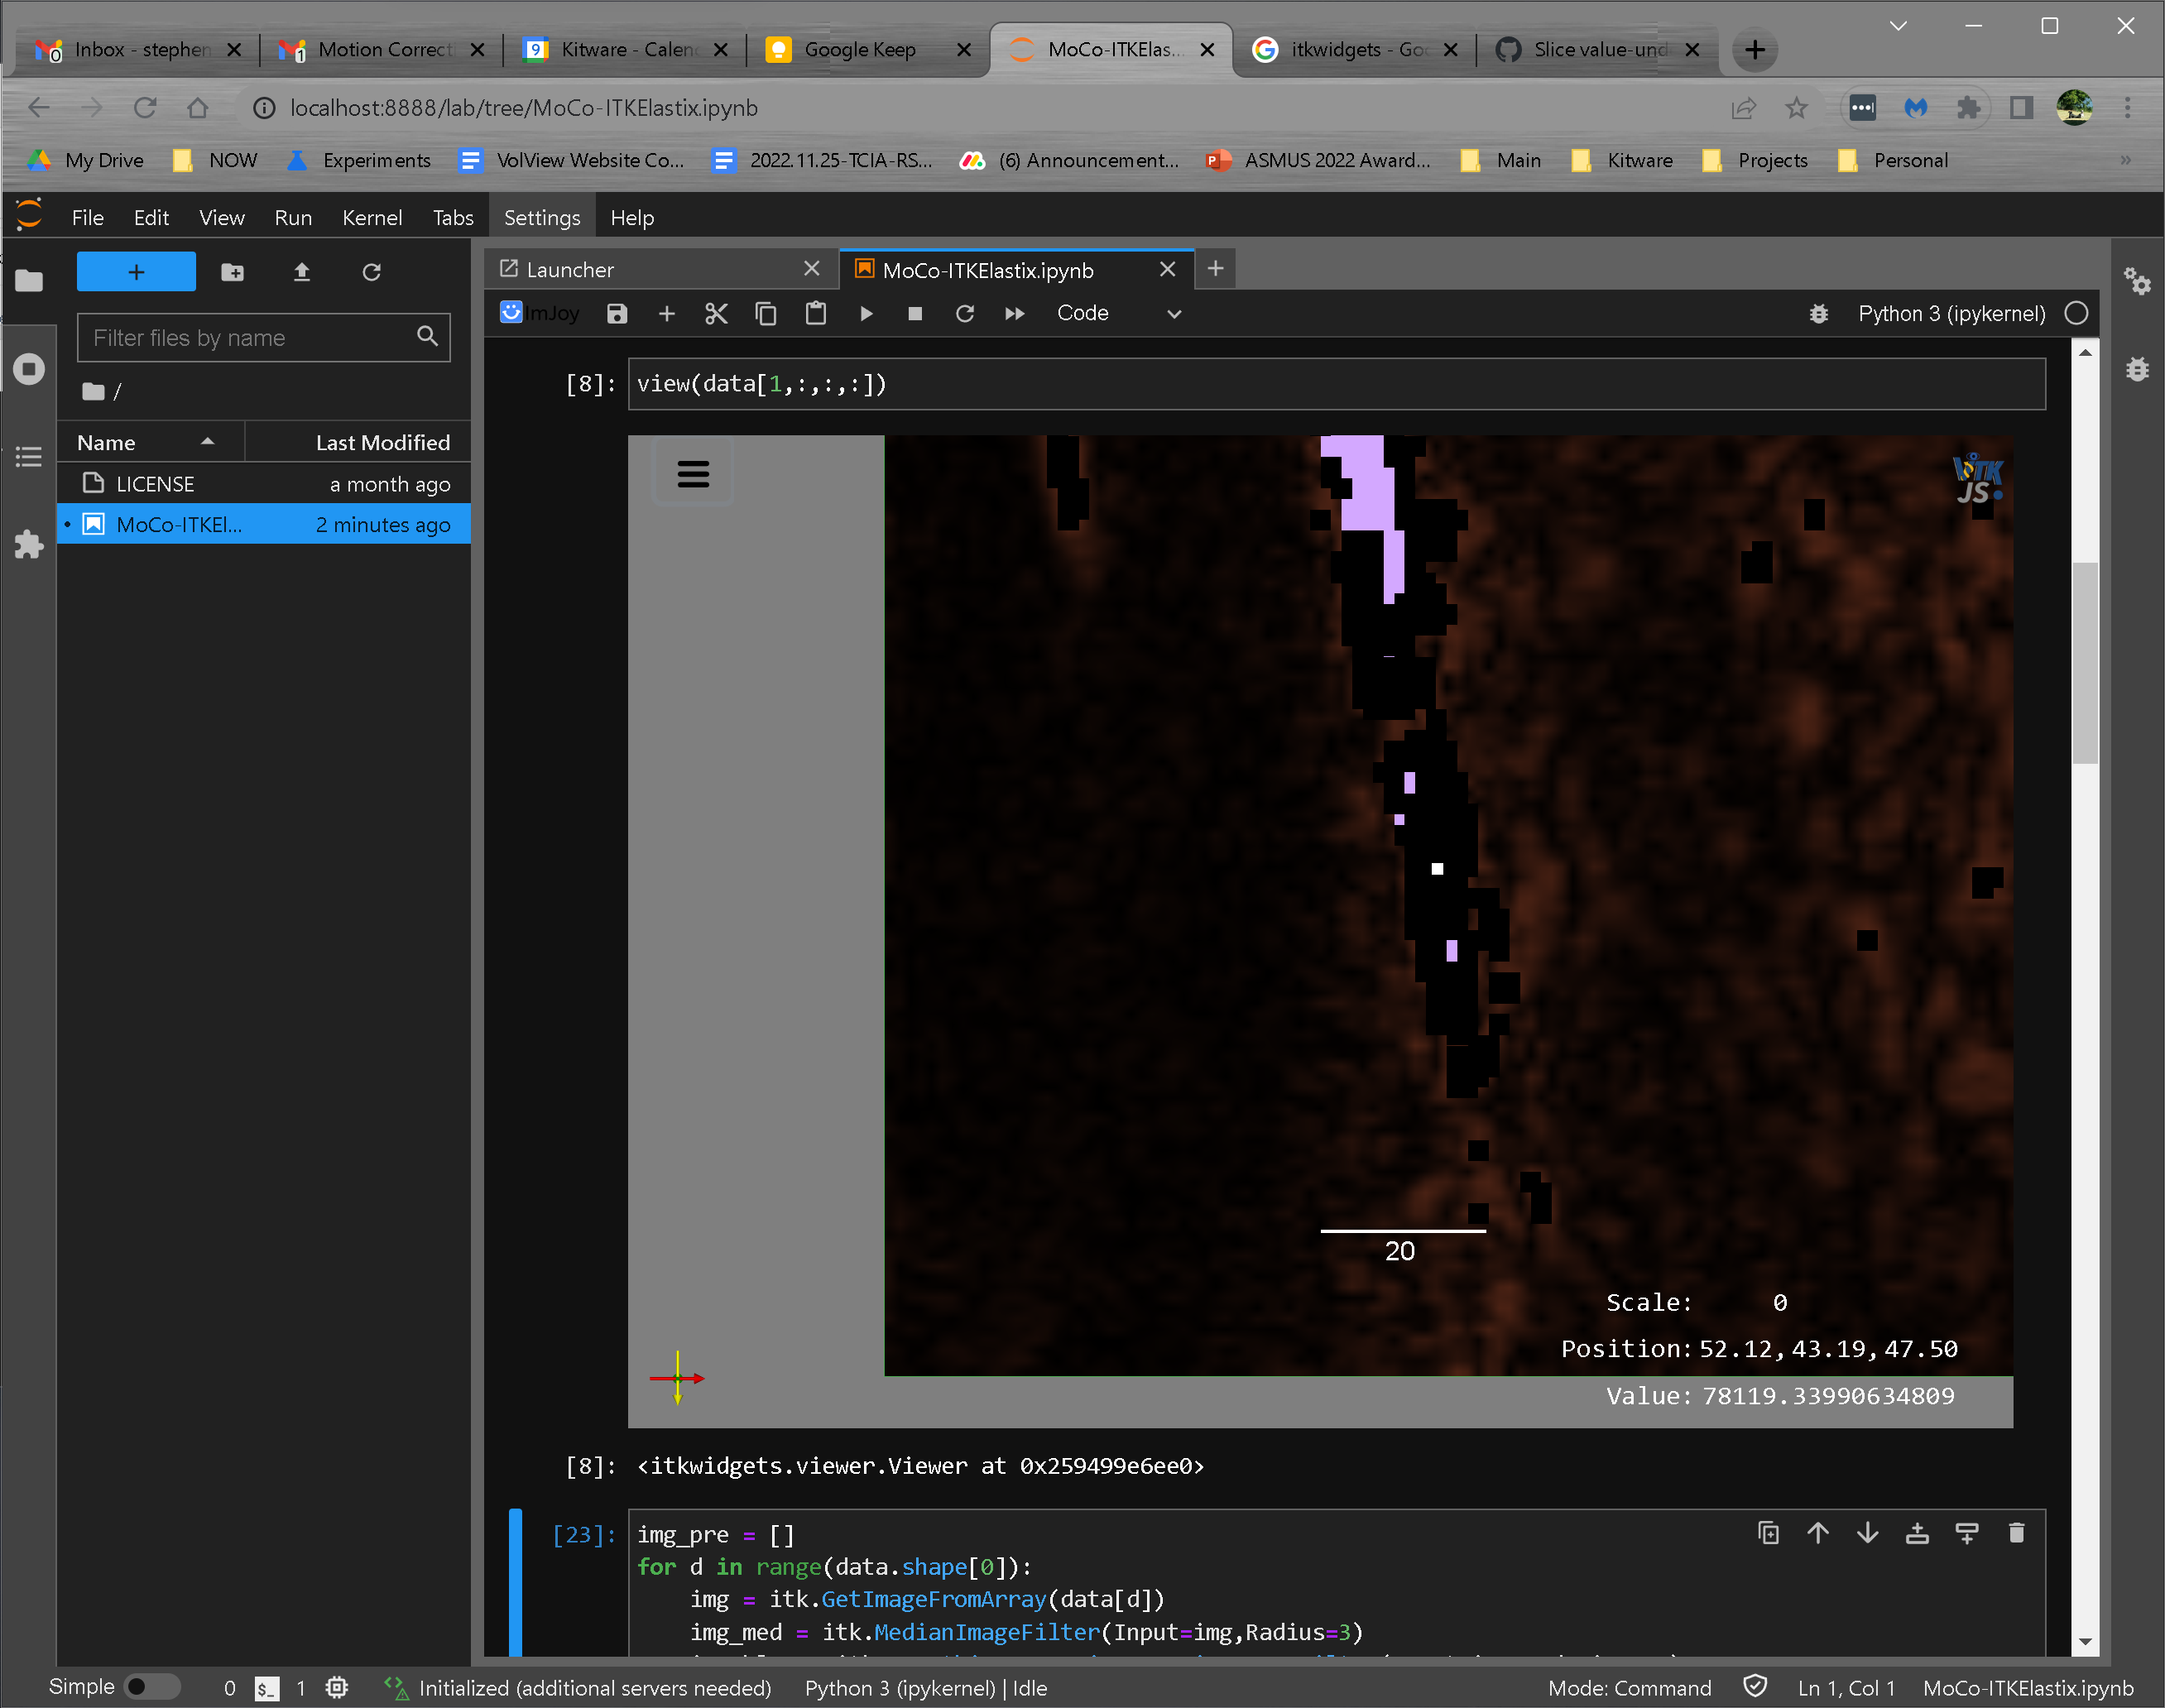
When the data is viewed as a slicer or in 3D, the color black is assigned to a range of intensities, regardless of which colormaps is used.
In the following example, the image has intensity range 8 to 410,000, and values around 80,000 are mapped to black. Changing the intensity range of the colormap, doesn't change which values are mapped to black. That is, the same voxels will always appear to be black.
コントリビューションガイド
このリポジトリのコントリビューションガイドは索引されていません
調査の方向性
まず、強度範囲を 8 から 410,000 にして、slicer ビューと 3D ビューの両方で問題を再現し、次に異なるカラーマップと調整した範囲で表示されるボクセルを比較します。80,000 前後の値が黒にマッピングされなくなり、カラーマップ範囲の変更に対して結果が正しく反応するようになれば、作業は完了です。
索引モデルが issue の本文から書いたものです。
評価
- 技術スタック
- jupyter, python
- 領域
- data-visualization
- issue の種類
- バグ
- 難易度
- 4/5
- 見積もり時間
- 3〜5日
- 活発さ
- 停滞
- 明瞭さ
- おおむね明確
- 初心者へのやさしさ
- 35/100