ISISComputingGroup / ISISComputingGroup/IBEX
Log Plotter: Plot whether you were running
- Dominant language
- No language data
- Stars
- 6
- Forks
- 2
- Avg merge
- 16h 40m
- Merged PRs (30d)
- 2
Description
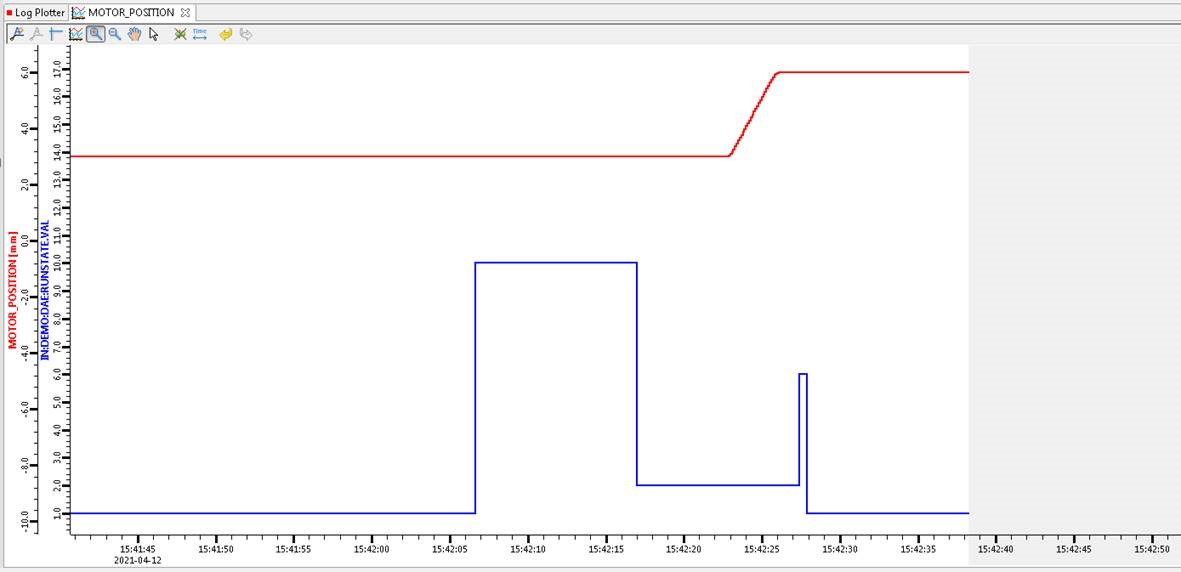
As a muon instrument scientist I would like to easily see the periods where I was running alongside the values of blocks in a plot. Currently the best we can do is plot the runstate but this is quite a manual process as documented at (https://github.com/ISISComputingGroup/ibex_user_manual/wiki/Plot-a-Block-Graph#plot-a-graph-of-the-runstate) and gives something that isn't very user friendly:
## Acceptance Criteria
* It is easier to plot this information (maybe a checkbox on the log plotter itself or by right clicking on the dashboard)
* The information is easier to interpret, at a minimum we should reduce the states down to just running/not running but ideally scientists would like a shaded area for the running parts (like requested in https://github.com/ISISComputingGroup/IBEX/issues/4738)
* If the shaded area is too hard spin into a new ticket
Contributor guide
No contributing guide indexed for this repository
Assessment
This issue has not been assessed yet.