AdguardTeam / AdguardTeam/AdGuardHome
AGH reported statistics
- Lingua principale
- TypeScript
- Stelle
- 36.9k
- Fork
- 2.5k
- Metriche di merge delle PR
- Nessuna PR unita negli ultimi 30g
Descrizione
Issue Details
Version of AdGuard Home server:
AdGuard Home, version v0.106.3
How did you install AdGuard Home:
Docker Image
How did you setup DNS configuration:
System
If it's a router or IoT, please write device model:
Raspberry Pi 3 Model B+
CPU architecture:
arm
Operating system and version:
Raspberry Pi OS Kernel version: 5.10.17
Expected Behavior
Accurate statistics for the set time period
Actual Behavior
AGH reports statistics that doesn't add up
Additional Information
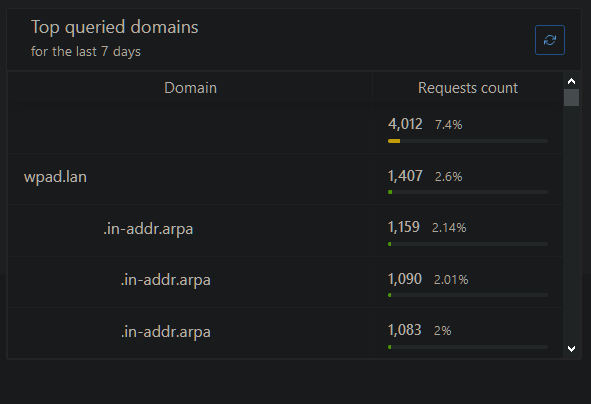
In the below image I have the top queried domain at 4,012 requests with a 7.4% of the total queried domains.
Statistics retention is set for 7 days and the uptime for AGH at the time of the screenshot is 6 days.
The top queried domain is added to the custom filters as an important domain using the "@@||abc.xyz^$important" rule.
Which doesn't make sense to me since the top queried domain is queried according to a keepalive script that runs every 5min to check for internet connectivity. So 4,012 x 5min = 20,060min / 1440 = 13.93days
I am using parallel query requests to speed up resolving by simultaneously querying all upstream servers.
I have 5 upstream servers, does AGH factor in the number of upstream servers in the total number of queries shown in the statistics when using parallel requests?
Guida per i contributori
Apri la guida per i contributori
Valutazione
Questa issue non è ancora stata valutata.