AdguardTeam / AdguardTeam/AdGuardHome
AGH reported statistics
- Vorherrschende Sprache
- TypeScript
- Sterne
- 36.9k
- Forks
- 2.5k
- PR-Merge-Kennzahlen
- Keine gemergten PRs in 30 T.
Beschreibung
Issue Details
Version of AdGuard Home server:
AdGuard Home, version v0.106.3
How did you install AdGuard Home:
Docker Image
How did you setup DNS configuration:
System
If it's a router or IoT, please write device model:
Raspberry Pi 3 Model B+
CPU architecture:
arm
Operating system and version:
Raspberry Pi OS Kernel version: 5.10.17
Expected Behavior
Accurate statistics for the set time period
Actual Behavior
AGH reports statistics that doesn't add up
Additional Information
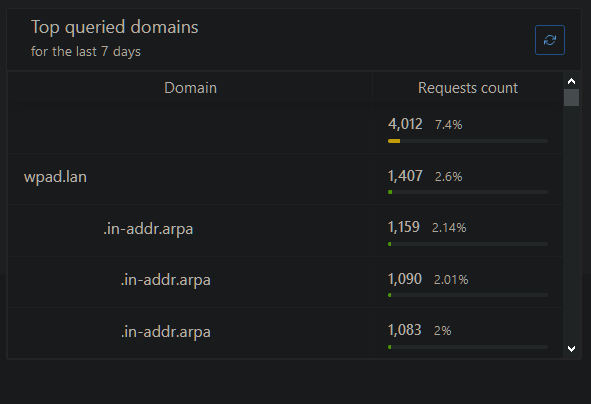
In the below image I have the top queried domain at 4,012 requests with a 7.4% of the total queried domains.
Statistics retention is set for 7 days and the uptime for AGH at the time of the screenshot is 6 days.
The top queried domain is added to the custom filters as an important domain using the "@@||abc.xyz^$important" rule.
Which doesn't make sense to me since the top queried domain is queried according to a keepalive script that runs every 5min to check for internet connectivity. So 4,012 x 5min = 20,060min / 1440 = 13.93days
I am using parallel query requests to speed up resolving by simultaneously querying all upstream servers.
I have 5 upstream servers, does AGH factor in the number of upstream servers in the total number of queries shown in the statistics when using parallel requests?
Beitragsleitfaden
Bewertung
Dieses Issue wurde noch nicht bewertet.