streamparticles() not working correctly
未关闭
还没有人认领这个 Issue。
- 主要语言
- MATLAB
- 星标
- 413
- 派生
- 166
- PR 合并指标
- 30 天内没有已合并 PR
描述
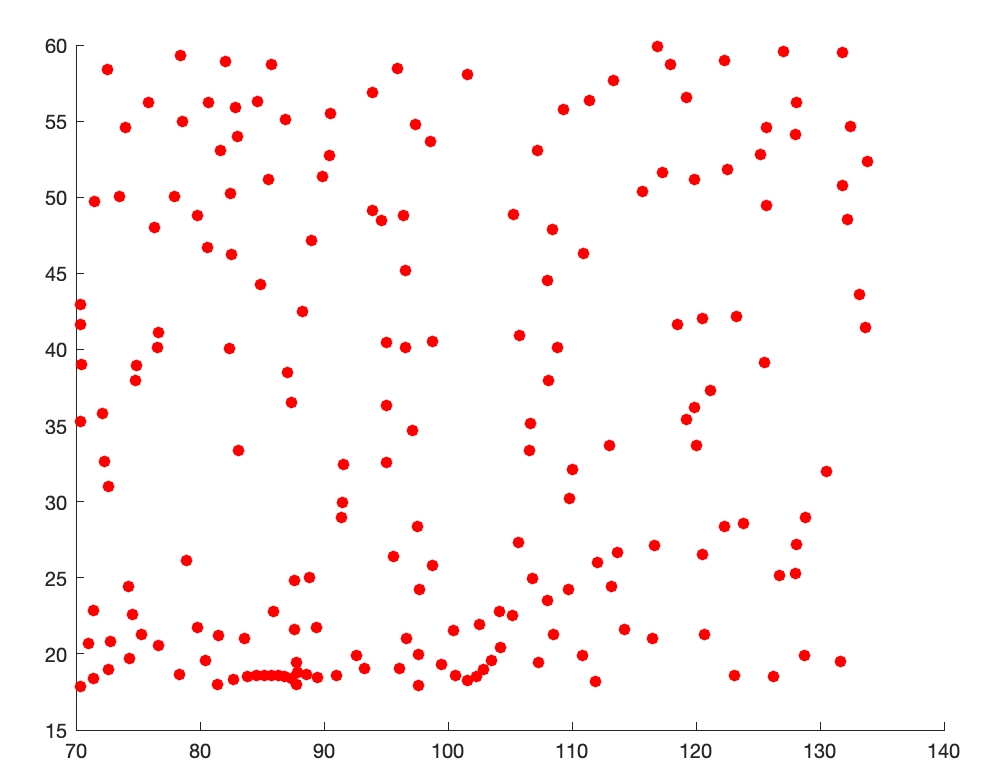
When using streamparticles() to draw stream particles of a vector field, the particles are plotted as a 3-D scatter chart.
load wind
[verts,averts] = streamslice(x,y,z,u,v,w,[],[],5);
iverts = interpstreamspeed(x,y,z,u,v,w,verts,.05);
streamparticles(iverts, 200)

fig2plotly(gcf, 'offline', false);
Expected and generated (https://chart-studio.plotly.com/~xarico10/1009/#/) plots:

Examples on using streamparticles() can be found on:
https://www.mathworks.com/help/matlab/ref/streamparticles.html
贡献指南
这个仓库没有索引到贡献指南
从这里开始
- 先读完整个 Issue,再读项目的贡献指南。
- 在 Issue 下留言说明你要接手 —— 这能避免两个人做同样的事。
- Fork 仓库,在一个分支上完成修改。
- 提交 Pull Request,并在描述里引用这个 Issue 编号。
调研方向
使用提供的 wind、streamslice()、interpstreamspeed()、streamparticles() 和 fig2plotly() 示例重现该问题,然后将生成的图表与预期图像以及 MathWorks 的 streamparticles() 示例进行比较。当转换后的绘图保留流粒子可视化效果,而不是将其渲染为 3-D 散点图时,即表示完成。
由索引模型根据 Issue 内容生成。
评估
- 技术栈
- matlab
- 领域
- data-visualization
- Issue 类型
- 缺陷
- 难度
- 3/5
- 预计耗时
- 1-2 天
- 活跃度
- 停滞
- 描述清晰度
- 基本清楚
- 新手友好度
- 35/100