enable matching secondary_y range to primary by each row of subplots
未关闭
还没有人认领这个 Issue。
feature
P3
- 主要语言
- Python
- 星标
- 18.8k
- 派生
- 2.8k
- 平均合并
- 16 小时 26 分钟
- 30 天内合并 PR
- 21
描述
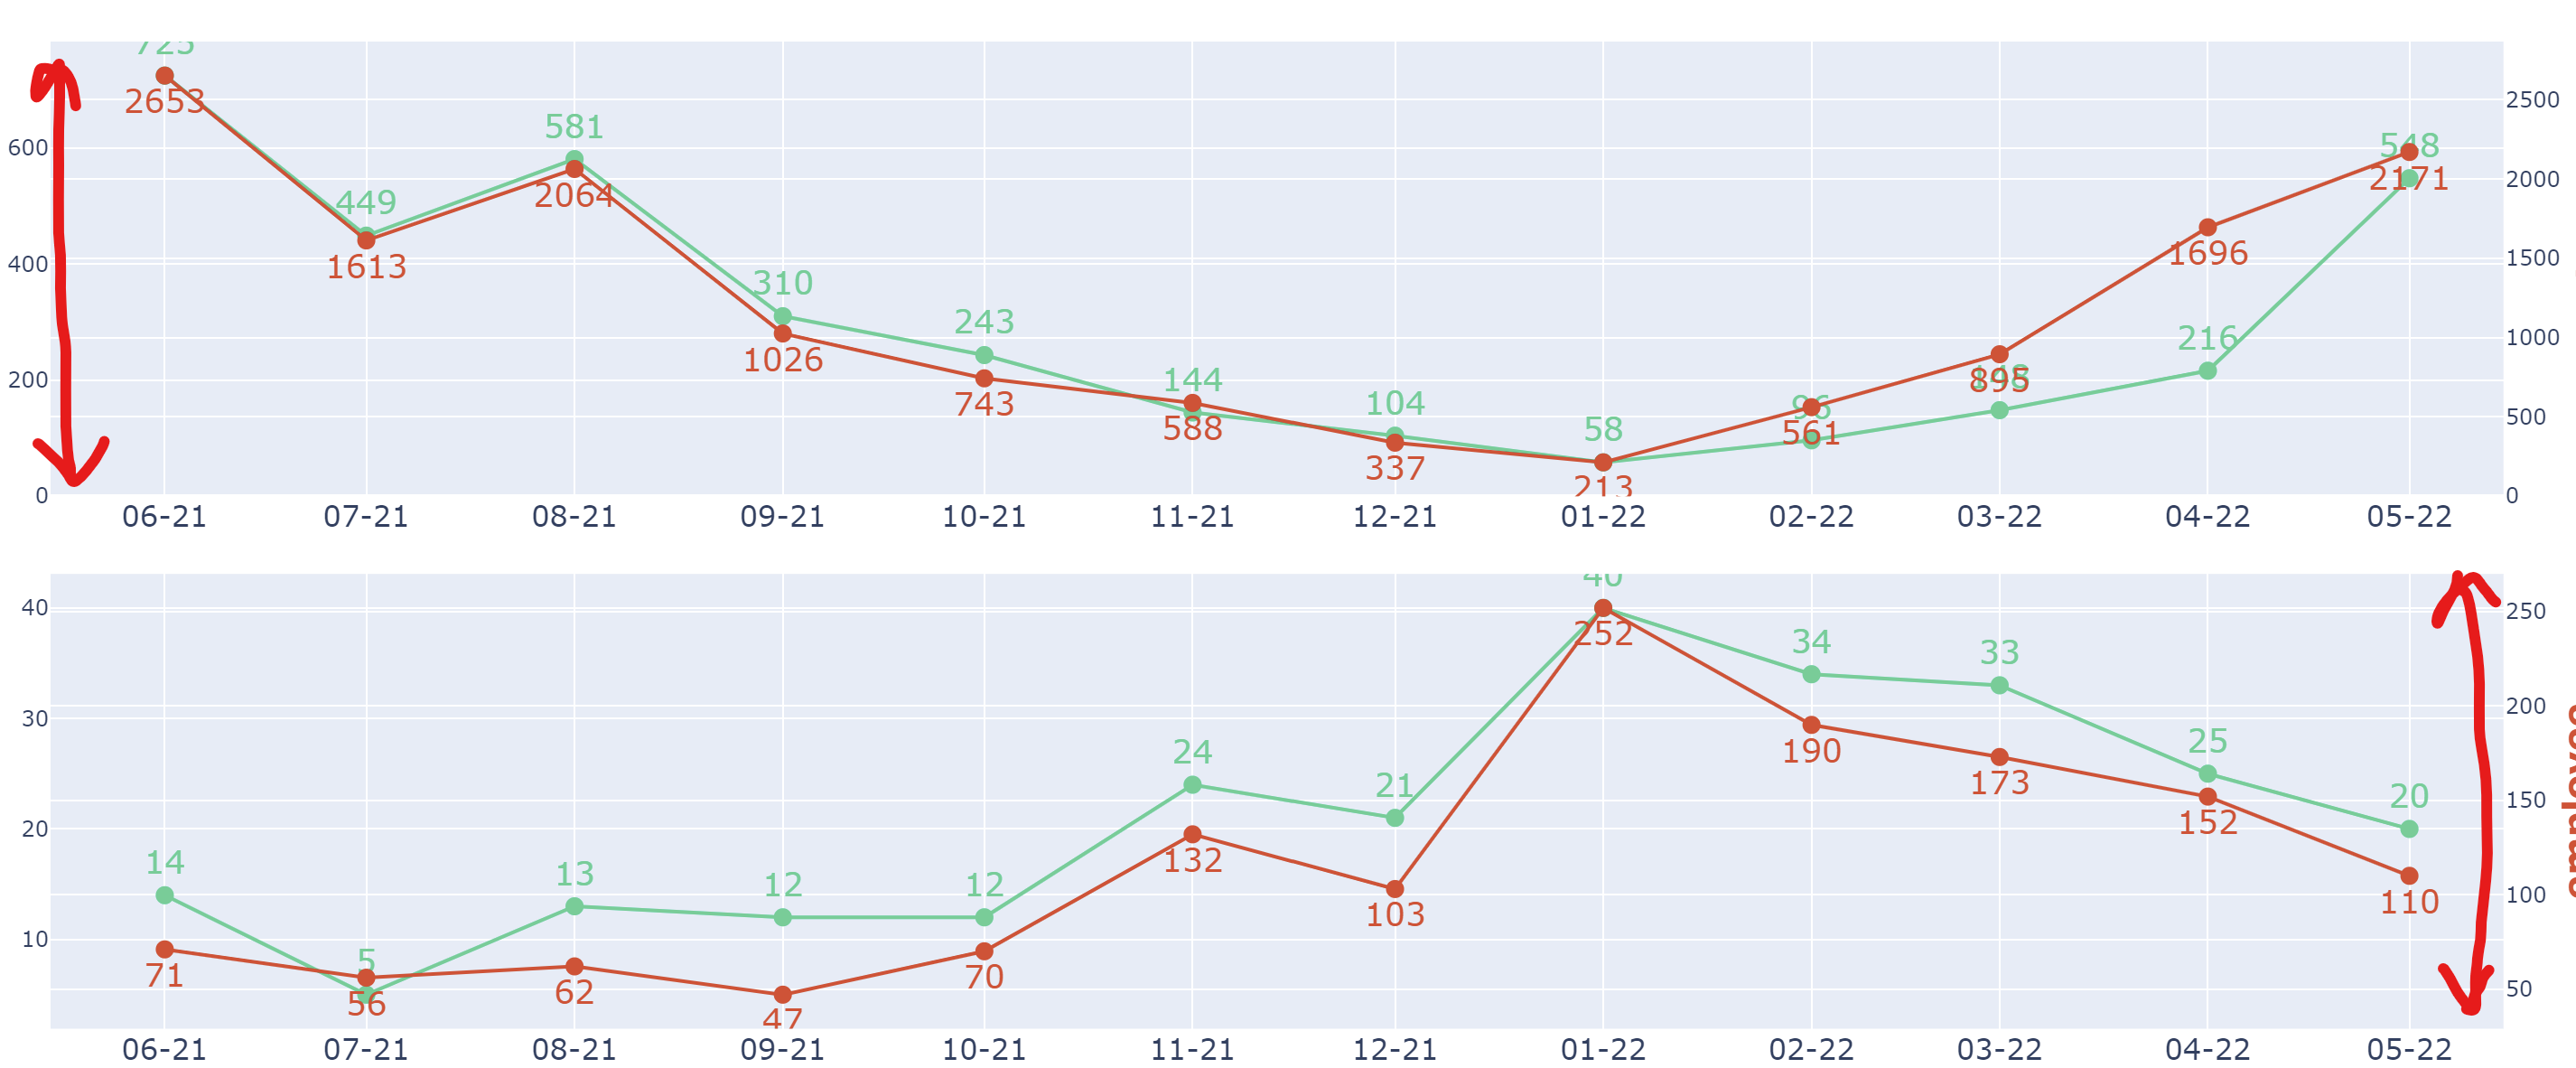
Hi, I have a subplot with 1 column and 5 rows. each plot in a row has a secondary_y axis. I would like to match the range of secondary_y and primary_y axis to each other, whichever has the max. I have been searching for quite some time, but could not find anything.

贡献指南
从这里开始
- 先读完整个 Issue,再读项目的贡献指南。
- 在 Issue 下留言说明你要接手 —— 这能避免两个人做同样的事。
- Fork 仓库,在一个分支上完成修改。
- 提交 Pull Request,并在描述里引用这个 Issue 编号。
调研方向
该 issue 未指定任何文件、测试或入口点。首先复现所描述的带有 secondary_y 轴的单列五行 subplot,并检查现有的 subplot 轴范围处理。完成的标准是:每一行的主范围和次范围分别独立匹配,使用较大的范围,并覆盖所报告的布局。
由索引模型根据 Issue 内容生成。
评估
- 技术栈
- python
- 领域
- data-visualization
- Issue 类型
- 功能
- 难度
- 4/5
- 预计耗时
- 3-5 天
- 活跃度
- 停滞
- 描述清晰度
- 基本清楚
- 新手友好度
- 25/100