enable matching secondary_y range to primary by each row of subplots
Open
Nobody has claimed this yet.
feature
P3
- Dominant language
- Python
- Stars
- 18.8k
- Forks
- 2.8k
- Avg merge
- 16h 26m
- Merged PRs (30d)
- 21
Description
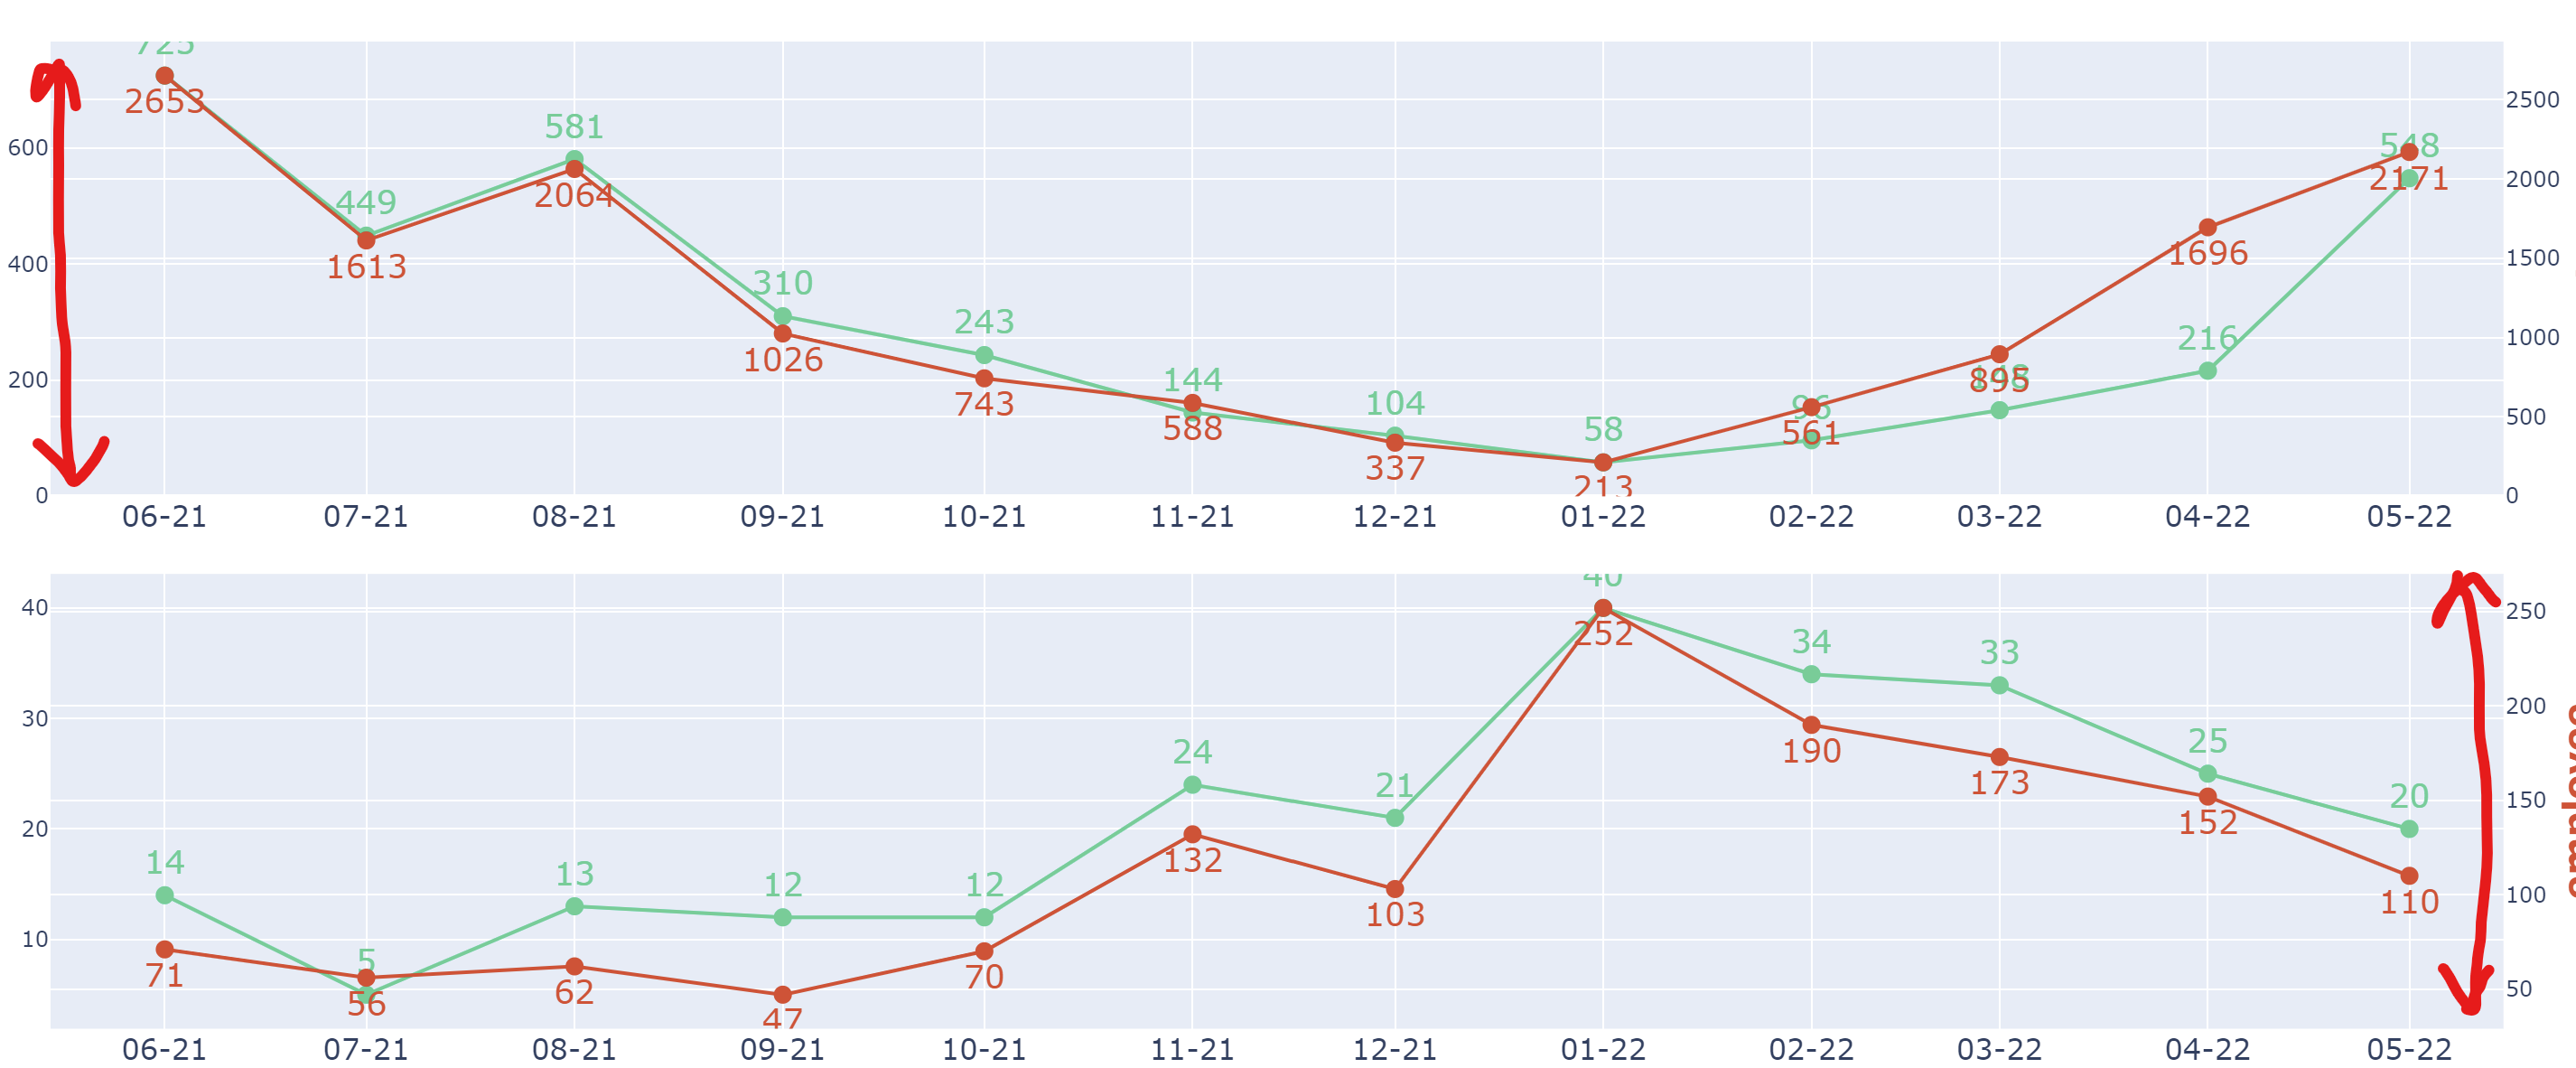
Hi, I have a subplot with 1 column and 5 rows. each plot in a row has a secondary_y axis. I would like to match the range of secondary_y and primary_y axis to each other, whichever has the max. I have been searching for quite some time, but could not find anything.

Contributor guide
First steps
- Read the whole issue, then the project's contributing guide.
- Comment on the issue to say you are picking it up — it saves two people doing the same work.
- Fork the repository and make your change on a branch.
- Open a pull request that references the issue number.
Research direction
The issue names no files, tests, or entry points. Start by reproducing the described one-column, five-row subplot with secondary_y axes and inspect existing subplot axis-range handling. Done means the primary and secondary ranges match independently for each row, using the larger range, with coverage for the reported layout.
Written by the indexing model from the issue text.
Assessment
- Tech stack
- python
- Domain
- data-visualization
- Issue type
- Feature
- Difficulty
- 4/5
- Estimated time
- 3-5 days
- Activity status
- Stale
- Clarity
- Mostly clear
- Newbie friendliness
- 25/100