Bug when using categorical axes and colors in plotly.express
未关闭
还没有人认领这个 Issue。
bug
P3
- 主要语言
- Python
- 星标
- 18.8k
- 派生
- 2.8k
- 平均合并
- 16 小时 26 分钟
- 30 天内合并 PR
- 21
描述
According to the documentation:
By default, Plotly Express lays out categorical data in the order in which it appears in the underlying data.
However, when using categorical axes in conjunction with colors, things do not show up in the order of the underlying data anymore.
import plotly.express as px
pdata_x = ["A","B",None,"B","C",None,"C","D", None, "D", "E", None]
pdata_y = [1,1,None,2,2,None,3,3,None,4,4,None]
pdata_color = [1,1,1,2,2,2,2,2,2,1,1,1]
px.line(x=pdata_x, y=pdata_y, color=pdata_color).show()
Output is

When not(!) using colors, we would get the correct output:
px.line(x=pdata_x, y=pdata_y ).show()

For anyone who comes across this problem, a temporary fix is explicitely specifying the category order:
px.line(x=pdata_x, y=pdata_y, color=pdata_color, category_orders={"x":["A","B","C","D"]}).show()
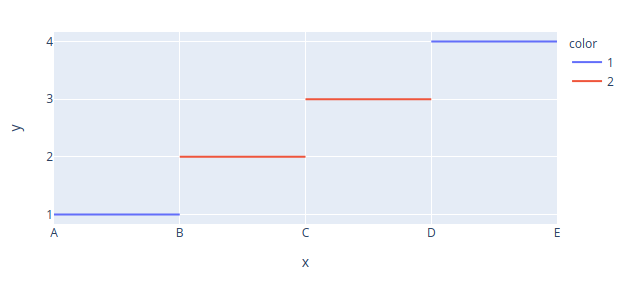
plotly==4.14.3
Python 3.8.0 (default, Feb 25 2021, 22:10:10)
贡献指南
从这里开始
- 先读完整个 Issue,再读项目的贡献指南。
- 在 Issue 下留言说明你要接手 —— 这能避免两个人做同样的事。
- Fork 仓库,在一个分支上完成修改。
- 提交 Pull Request,并在描述里引用这个 Issue 编号。
调研方向
首先运行提供的 Python 和 plotly.express px.line 示例,使用分类 x 值和颜色,然后将其与无颜色以及显式指定 category_orders 的情况进行比较。跟踪彩色线条的分类顺序是如何确定的。完成标准是:即使使用 color,默认顺序也遵循底层数据,同时文档中说明的显式顺序 workaround 仍能正常工作。
由索引模型根据 Issue 内容生成。
评估
- 技术栈
- python
- 领域
- data-visualization
- Issue 类型
- 缺陷
- 难度
- 3/5
- 预计耗时
- 1-2 天
- 活跃度
- 停滞
- 描述清晰度
- 基本清楚
- 新手友好度
- 45/100