Bug when using categorical axes and colors in plotly.express
Nobody has claimed this yet.
- Dominant language
- Python
- Stars
- 18.8k
- Forks
- 2.8k
- Avg merge
- 16h 26m
- Merged PRs (30d)
- 21
Description
According to the documentation:
By default, Plotly Express lays out categorical data in the order in which it appears in the underlying data.
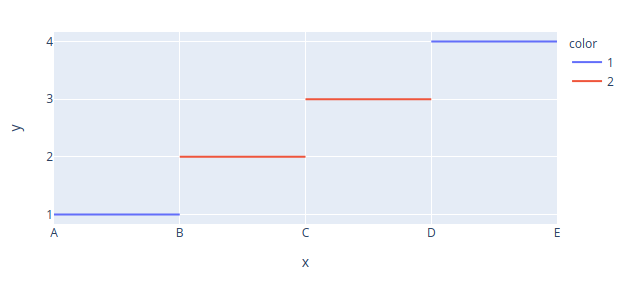
However, when using categorical axes in conjunction with colors, things do not show up in the order of the underlying data anymore.
import plotly.express as px
pdata_x = ["A","B",None,"B","C",None,"C","D", None, "D", "E", None]
pdata_y = [1,1,None,2,2,None,3,3,None,4,4,None]
pdata_color = [1,1,1,2,2,2,2,2,2,1,1,1]
px.line(x=pdata_x, y=pdata_y, color=pdata_color).show()
Output is

When not(!) using colors, we would get the correct output:
px.line(x=pdata_x, y=pdata_y ).show()

For anyone who comes across this problem, a temporary fix is explicitely specifying the category order:
px.line(x=pdata_x, y=pdata_y, color=pdata_color, category_orders={"x":["A","B","C","D"]}).show()
plotly==4.14.3
Python 3.8.0 (default, Feb 25 2021, 22:10:10)
Contributor guide
First steps
- Read the whole issue, then the project's contributing guide.
- Comment on the issue to say you are picking it up — it saves two people doing the same work.
- Fork the repository and make your change on a branch.
- Open a pull request that references the issue number.
Research direction
Start by running the supplied Python and plotly.express px.line example with categorical x values and colors, then compare it with the no-color and explicit category_orders cases. Trace how categorical ordering is determined for colored lines. Done means the default order follows the underlying data even when color is used, while the documented explicit-order workaround continues to work.
Written by the indexing model from the issue text.
Assessment
- Tech stack
- python
- Domain
- data-visualization
- Issue type
- Bug
- Difficulty
- 3/5
- Estimated time
- 1-2 days
- Activity status
- Stale
- Clarity
- Mostly clear
- Newbie friendliness
- 45/100