incorrect representation of mixed rgb and rgba colors in mesh3d
还没有人认领这个 Issue。
- 主要语言
- Python
- 星标
- 18.8k
- 派生
- 2.8k
- 平均合并
- 16 小时 26 分钟
- 30 天内合并 PR
- 21
描述
Hi folks!
I encountered some unexpected behavior in Mesh3d. I hope you could have a look. It is hard for me to judge if these are issues, here or upstream, or I am missing something.
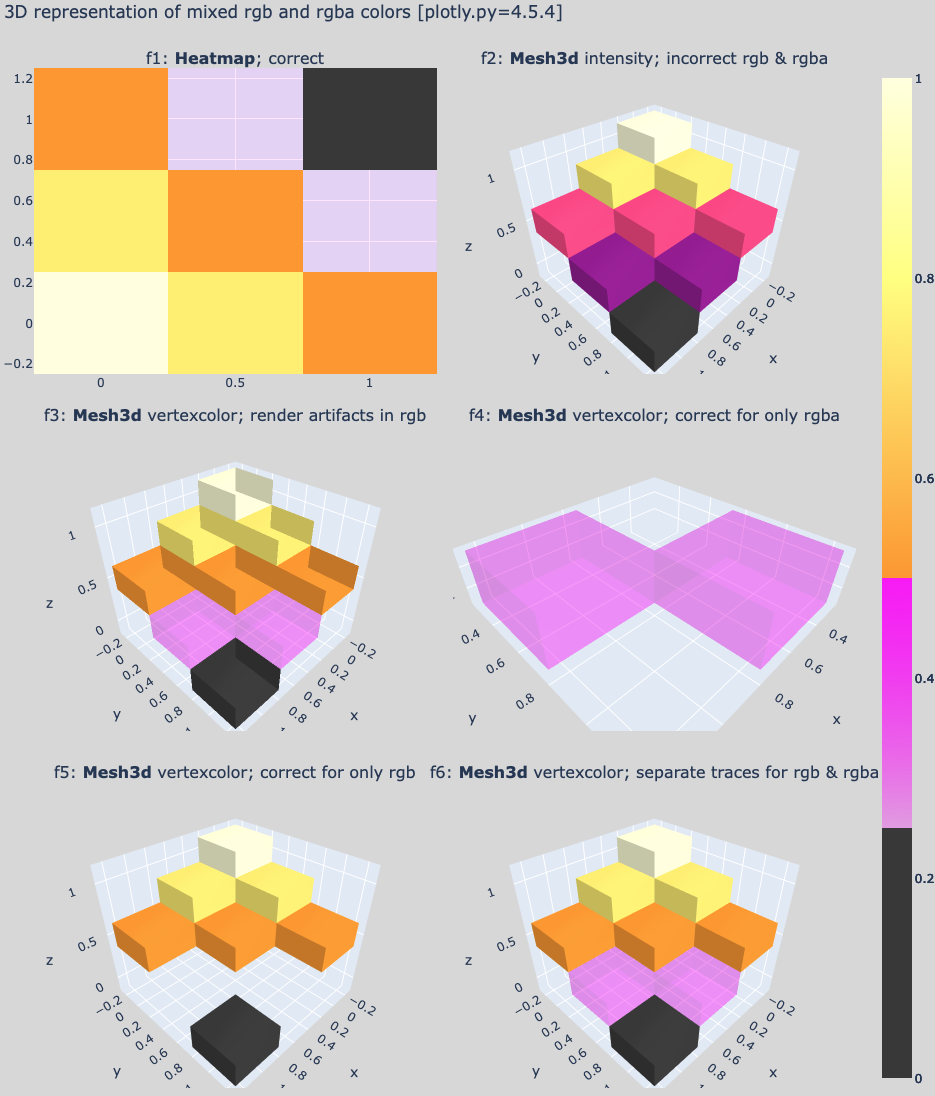
-
Incorrect colors in plots with
intensityand a discontinuouscolorscale(see panel f2).
a) Colors with opacity (rgba) are shown without opacity (rgb). This issue was reported before.
b) Discontinuous transitions in thecolorscaleappear to be ignored. As a result, colors are introduced that are not found in the colorscale. In the example, panel f2: purple = black + magenta, raspberry = magenta + orange.
c) I would expect the same colorscale behavior as in 'scatter' or 'heatmap' (panel f1). -
Render artifacts occur for
facecolororvertexcolorsurfaces, when rgb and rgba colors are put in the same trace (see panel f3).
a) Surfaces do look opaque when only rgb colors are present (panel f5).
b) A partial workaround was to plot rgb and rgba vertices in separate traces (panel f6). Not sure what to do when vertices have a gradient between rgb and rgba... -
An additional trace is needed to add a colorbar when
facecolororvertexcoloris used instead ofintensity.
a) I do expect the colorbar to be dropped when colors are hardcoded. But the workaround to add a customcolorbarorcoloraxiswith a 'hidden' trace may not be obvious to everyone. Add an example to the documentation? -
The rgba colors in the
colorbarappear mixed with layoutpaper_bgcolor, effectively the transparent magenta colors are too dark in the Working Example.
a) Can acolorbarbackground be set to match the (default) plot background color? -
The image above is a screenshot and differs from the exported image, using
f7.write_image(...)after the Working Example below.
a) In my exported copy, some of the layoutsceneaxes appeared 'ghost'-duplicated into the next subplot. Only visible if the scene axes (ranges) change between subplots. Issue on my system or in Orca?
Screenshot 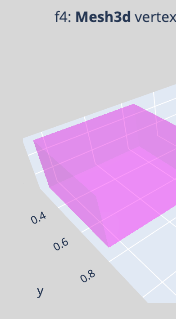 vs Orca[1.3.0]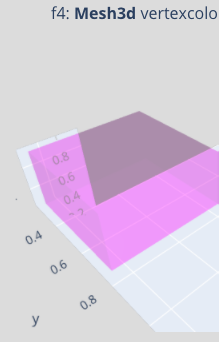
Finally, for a large number of shapes (or animations) I noticed significant performance loss in looking up and hardcoding the colors of vertices. Ideally, I would get the intensity method of Mesh3d to give me the expected result (more like f6, less like f2). Any ideas? Your advise is appreciated!
import numpy as np
import itertools
import plotly as py
import plotly.graph_objects as go
from plotly.subplots import make_subplots

def flatten_dict(d):
    return({k: [y for x in [v[k] for v in d] for y in x] for k in d[0]})

def reindex_voxels(dl):
    m=0
    res = []
    for i,od in enumerate(dl):
        ix = len(dl[i]['x'])
        d = od.copy()
        for n in ['i','j','k']:
            d[n] = [ m + j for j in d[n] ]
        m += ix
        res.append(d)
    return(flatten_dict(res))

# some data
x = y = np.linspace(0,1,3)
x,y = np.meshgrid(x,y)
z = 1-(x+y)/2

# custom colorscale, mixed rgb and rgba, discontinuous breaks
cs = [[0.0, 'rgb(64, 64, 64)'],
    [0.25, 'rgb(64, 64, 64)'],
    [0.25, 'rgba(255, 0, 255, 0.1)'],
    [0.5, 'rgba(255, 0, 255, 0.5)'],
    [0.5, 'rgb(255, 160, 33)'],
    [0.8, 'rgb(255, 255, 129)'],
    [1.0, 'rgb(255, 255, 225)']]

# list of shapes
vxl = \
[{'x': [-0.25, -0.25, 0.25, 0.25, -0.25, -0.25, 0.25, 0.25],
  'y': [-0.25, 0.25, 0.25, -0.25, -0.25, 0.25, 0.25, -0.25],
  'z': [0.875, 0.875, 0.875, 0.875, 1.125, 1.125, 1.125, 1.125],
  'i': [7, 0, 0, 0, 4, 4, 2, 6, 4, 0, 3, 7],
  'j': [3, 4, 1, 2, 5, 6, 5, 5, 0, 1, 2, 2],
  'k': [0, 7, 2, 3, 6, 7, 1, 2, 5, 5, 7, 6],
  'intensity': [1.0, 1.0, 1.0, 1.0, 1.0, 1.0, 1.0, 1.0]},
 {'x': [0.25, 0.25, 0.75, 0.75, 0.25, 0.25, 0.75, 0.75],
  'y': [-0.25, 0.25, 0.25, -0.25, -0.25, 0.25, 0.25, -0.25],
  'z': [0.625, 0.625, 0.625, 0.625, 0.875, 0.875, 0.875, 0.875],
  'i': [7, 0, 0, 0, 4, 4, 2, 6, 4, 0, 3, 7],
  'j': [3, 4, 1, 2, 5, 6, 5, 5, 0, 1, 2, 2],
  'k': [0, 7, 2, 3, 6, 7, 1, 2, 5, 5, 7, 6],
  'intensity': [0.75, 0.75, 0.75, 0.75, 0.75, 0.75, 0.75, 0.75]},
 {'x': [0.75, 0.75, 1.25, 1.25, 0.75, 0.75, 1.25, 1.25],
  'y': [-0.25, 0.25, 0.25, -0.25, -0.25, 0.25, 0.25, -0.25],
  'z': [0.375, 0.375, 0.375, 0.375, 0.625, 0.625, 0.625, 0.625],
  'i': [7, 0, 0, 0, 4, 4, 2, 6, 4, 0, 3, 7],
  'j': [3, 4, 1, 2, 5, 6, 5, 5, 0, 1, 2, 2],
  'k': [0, 7, 2, 3, 6, 7, 1, 2, 5, 5, 7, 6],
  'intensity': [0.5, 0.5, 0.5, 0.5, 0.5, 0.5, 0.5, 0.5]},
 {'x': [-0.25, -0.25, 0.25, 0.25, -0.25, -0.25, 0.25, 0.25],
  'y': [0.25, 0.75, 0.75, 0.25, 0.25, 0.75, 0.75, 0.25],
  'z': [0.625, 0.625, 0.625, 0.625, 0.875, 0.875, 0.875, 0.875],
  'i': [7, 0, 0, 0, 4, 4, 2, 6, 4, 0, 3, 7],
  'j': [3, 4, 1, 2, 5, 6, 5, 5, 0, 1, 2, 2],
  'k': [0, 7, 2, 3, 6, 7, 1, 2, 5, 5, 7, 6],
  'intensity': [0.75, 0.75, 0.75, 0.75, 0.75, 0.75, 0.75, 0.75]},
 {'x': [0.25, 0.25, 0.75, 0.75, 0.25, 0.25, 0.75, 0.75],
  'y': [0.25, 0.75, 0.75, 0.25, 0.25, 0.75, 0.75, 0.25],
  'z': [0.375, 0.375, 0.375, 0.375, 0.625, 0.625, 0.625, 0.625],
  'i': [7, 0, 0, 0, 4, 4, 2, 6, 4, 0, 3, 7],
  'j': [3, 4, 1, 2, 5, 6, 5, 5, 0, 1, 2, 2],
  'k': [0, 7, 2, 3, 6, 7, 1, 2, 5, 5, 7, 6],
  'intensity': [0.5, 0.5, 0.5, 0.5, 0.5, 0.5, 0.5, 0.5]},
 {'x': [0.75, 0.75, 1.25, 1.25, 0.75, 0.75, 1.25, 1.25],
  'y': [0.25, 0.75, 0.75, 0.25, 0.25, 0.75, 0.75, 0.25],
  'z': [0.125, 0.125, 0.125, 0.125, 0.375, 0.375, 0.375, 0.375],
  'i': [7, 0, 0, 0, 4, 4, 2, 6, 4, 0, 3, 7],
  'j': [3, 4, 1, 2, 5, 6, 5, 5, 0, 1, 2, 2],
  'k': [0, 7, 2, 3, 6, 7, 1, 2, 5, 5, 7, 6],
  'intensity': [0.25, 0.25, 0.25, 0.25, 0.25, 0.25, 0.25, 0.25]},
 {'x': [-0.25, -0.25, 0.25, 0.25, -0.25, -0.25, 0.25, 0.25],
  'y': [0.75, 1.25, 1.25, 0.75, 0.75, 1.25, 1.25, 0.75],
  'z': [0.375, 0.375, 0.375, 0.375, 0.625, 0.625, 0.625, 0.625],
  'i': [7, 0, 0, 0, 4, 4, 2, 6, 4, 0, 3, 7],
  'j': [3, 4, 1, 2, 5, 6, 5, 5, 0, 1, 2, 2],
  'k': [0, 7, 2, 3, 6, 7, 1, 2, 5, 5, 7, 6],
  'intensity': [0.5, 0.5, 0.5, 0.5, 0.5, 0.5, 0.5, 0.5]},
 {'x': [0.25, 0.25, 0.75, 0.75, 0.25, 0.25, 0.75, 0.75],
  'y': [0.75, 1.25, 1.25, 0.75, 0.75, 1.25, 1.25, 0.75],
  'z': [0.125, 0.125, 0.125, 0.125, 0.375, 0.375, 0.375, 0.375],
  'i': [7, 0, 0, 0, 4, 4, 2, 6, 4, 0, 3, 7],
  'j': [3, 4, 1, 2, 5, 6, 5, 5, 0, 1, 2, 2],
  'k': [0, 7, 2, 3, 6, 7, 1, 2, 5, 5, 7, 6],
  'intensity': [0.25, 0.25, 0.25, 0.25, 0.25, 0.25, 0.25, 0.25]},
 {'x': [0.75, 0.75, 1.25, 1.25, 0.75, 0.75, 1.25, 1.25],
  'y': [0.75, 1.25, 1.25, 0.75, 0.75, 1.25, 1.25, 0.75],
  'z': [-0.125, -0.125, -0.125, -0.125, 0.125, 0.125, 0.125, 0.125],
  'i': [7, 0, 0, 0, 4, 4, 2, 6, 4, 0, 3, 7],
  'j': [3, 4, 1, 2, 5, 6, 5, 5, 0, 1, 2, 2],
  'k': [0, 7, 2, 3, 6, 7, 1, 2, 5, 5, 7, 6],
  'intensity': [0.0, 0.0, 0.0, 0.0, 0.0, 0.0, 0.0, 0.0]}]

# shape colors
cid = ['rgb(255, 255, 220)','rgb(255, 239, 113)',
       'rgb(255, 160, 33)','rgb(255, 239, 113)',
       'rgb(255, 160, 33)','rgba(255, 0, 255, 0.2)',
       'rgb(255, 160, 33)','rgba(255, 0, 255, 0.2)',
       'rgb(64, 64, 64)']

# concatenate shapes
vxa = reindex_voxels(vxl)

# concatenate and replace 'intensity' with 'vertexcolor'
vxb = reindex_voxels([{**{i:j for i,j in v.items() if i in ['x','y','z','i','j','k']},
                       **{'vertexcolor': [k]*len(v['x'])}} for k,v in zip(cid,vxl)])

# split vertices with opacity (rgba) and without opacity (rgb) , and replace 'intensity' by 'vertexcolor'
vxc0 = reindex_voxels([{**{i:j for i,j in v.items() if i in ['x','y','z','i','j','k']},
                        **{'vertexcolor': [k]*len(v['x'])}} for k,v in zip(cid,vxl) if k.startswith('rgba(')])
vxc1 = reindex_voxels([{**{i:j for i,j in v.items() if i in ['x','y','z','i','j','k']},
                        **{'vertexcolor': [k]*len(v['x'])}} for k,v in zip(cid,vxl) if k.startswith('rgb(')])

# figures
f1 = go.Figure(data=[go.Heatmap(x=x.ravel(),y=y.ravel(),z=z.ravel(),colorscale=cs)])
f2 = go.Figure(data=[go.Mesh3d(**vxa,colorscale=cs)])
f3 = go.Figure(data=[go.Mesh3d(**vxb,colorscale=cs)])
f4 = go.Figure(data=[go.Mesh3d(**vxc0)])
f5 = go.Figure(data=[go.Mesh3d(**vxc1)])

# multiple traces; 'vertexcolor' for rgb and rgba _and_ a transparent trace with 'intensity' to add a 'colorscale'
f6 = go.Figure(data=[go.Mesh3d(**vxc0),
                     go.Mesh3d(**vxc1),
                     go.Mesh3d(**vxa,opacity=0,colorscale=cs)])

#f6.show()

# merge figures
ncol=2
nrow=3
fig = make_subplots(cols=ncol,rows=nrow,vertical_spacing=0.05,horizontal_spacing=0.02,
                    specs= ( np.array([{'type':'heatmap'},{'type':'scatter3d'}]+[{'type':'scatter3d'}]*4)
                            .reshape(nrow,ncol).tolist() ),
                    subplot_titles=['f1: <b>Heatmap</b>; correct',
                                    'f2: <b>Mesh3d</b> intensity; incorrect rgb & rgba',
                                    'f3: <b>Mesh3d</b> vertexcolor; render artifacts in rgb',
                                    'f4: <b>Mesh3d</b> vertexcolor; correct for only rgba',
                                    'f5: <b>Mesh3d</b> vertexcolor; correct for only rgb',
                                    'f6: <b>Mesh3d</b> vertexcolor; separate traces for rgb & rgba'])
fig.update_layout(height=1200,width=1000,title_text='3D representation of mixed rgb and rgba colors [plotly.py={}]'.format(py.__version__))

f7 = go.Figure(fig)
for loc,f in zip(list(itertools.product(*[range(1,nrow+1),range(1,ncol+1)])),[f1,f2,f3,f4,f5,f6]):
    if f is not None:
        for d in f['data']:
            f7.add_trace(d,row=loc[0],col=loc[1])

f7.show()
Sorry, not a very short MWE...
贡献指南
从这里开始
- 先读完整个 Issue,再读项目的贡献指南。
- 在 Issue 下留言说明你要接手 —— 这能避免两个人做同样的事。
- Fork 仓库,在一个分支上完成修改。
- 提交 Pull Request,并在描述里引用这个 Issue 编号。
调研方向
未指定任何仓库文件或测试。首先运行提供的 Python reproduction,并区分 Mesh3d intensity、vertexcolor、colorbar 和 export-rendering 报告;然后确定哪些行为属于 plotly.py,哪些属于 Plotly.js 或 Orca。完成的条件是具备 maintainer 批准的范围、一个聚焦的 reproduction,以及相应的回归覆盖。
由索引模型根据 Issue 内容生成。
评估
- 技术栈
- python
- 领域
- data-visualization
- Issue 类型
- 缺陷
- 难度
- 5/5
- 预计耗时
- 一周以上
- 活跃度
- 停滞
- 描述清晰度
- 需要澄清
- 新手友好度
- 18/100